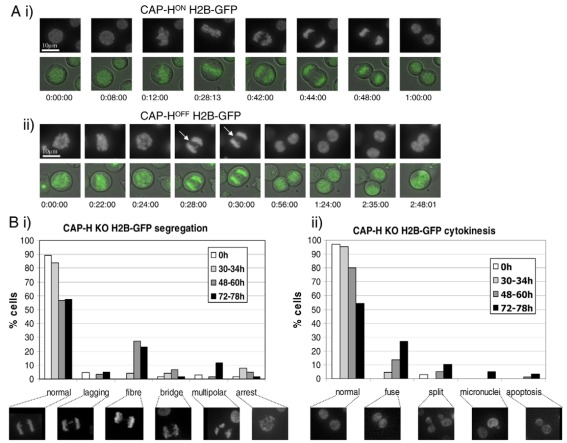
Fig. 5.
Live-cell imaging analysis of CAP-H knockout H2B–GFP cell lines. (A) Comparison of CAP-H KO cell line (i) without and (ii) with doxycycline (+ 52 hours). The cell line contains the transgene encoding H2B–GFP. Fluorescence and DIC images are shown for each mitotic series. Note that, in (ii), a thread appears (white arrow) during anaphase, and the daughter cells fuse (last panel) approximately two hours after telophase. These are the two most common segregation and cytokinesis defects in CAP-HOFF cells. (B) Quantitative live-cell analysis of CAP-H KO:H2B–GFP cell line. (i) Chromosome-segregation defects are shown in the following categories: chromosome lagging, chromatin fibre, chromosome bridge, multipolar anaphases and mitotic arrest (representing cells in mitosis for over 2 hours). (ii) Cytokinesis defects are shown in the following categories: cell fusion, split (which represents separated chromatids that undergo a further division during telophase or cytokinesis), micronuclei and apoptosis. Representative images of each defect category are shown below the bar chart. The following numbers of cells or independent movies were scored for each time-point: N=66 (0 hours dox), N=21 (+dox 30–34h), N=49 (+dox 48–60h) and N=31 (+dox 72–78h).

