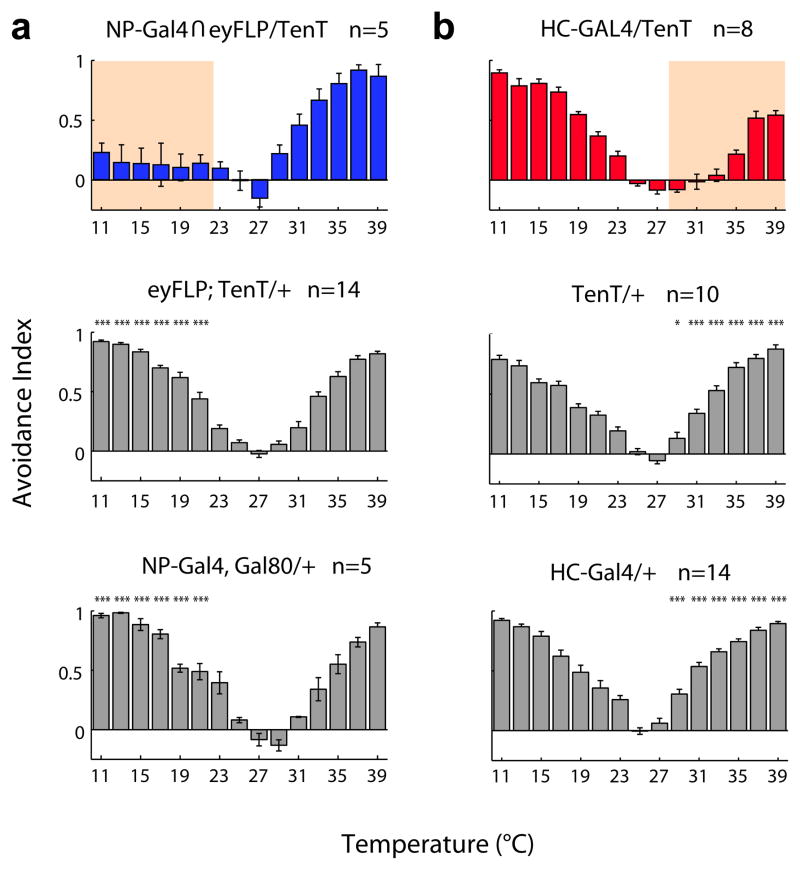
Figure 6. Labeled lines for temperature processing.
(a, b) The behavioral effects of the inactivation of cold and hot thermoreceptors reveal separate channels for the processing of cold and hot temperatures. (a) Expression of tetanus toxin in antennal cold receptors results in significant loss of aversion for temperatures in the 11-23°C range. In contrast, (b) Inactivation of hot receptors results in the reciprocal phenotype, a selective loss of aversion to temperatures above 29°C. Shown below each experimental genotype are the thermal preference records for the parental control lines (gray bars). Pink shading in (a) and (b) highlights AI values significantly different from both appropriate parental strains (n>5, mean±SEM; *** = p<0.001, ** = p<0.01, * = p<0.05, ANOVA, see methods for details).

