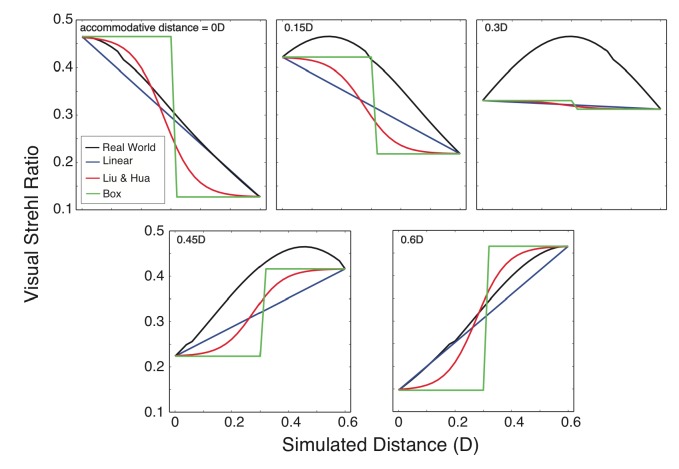
Fig. 10.
Perceived optical quality for a thin white line receding in depth. We calculated Visual Strehl ratios (observed PSF peak divided by PSF peak for well-focused, diffraction-limited eye, where the PSFs have been weighted by the NTF [35]) for different horizontal positions along the line. Black, blue, red, and green symbols represent, respectively, the ratios for a real-world stimulus, a multi-plane stimulus with the linear blending rule, a multi-plane stimulus with Liu and Hua’s non-linear blending rule [16], and a multi-plane stimulus with a box-function rule. The panels show the results when the eye is accommodated to 0D (the far end of the line), 0.15, 0.3, 0.45, and 0.6D (the near end of the line). The parameters of the model eye are given in Table 1.

