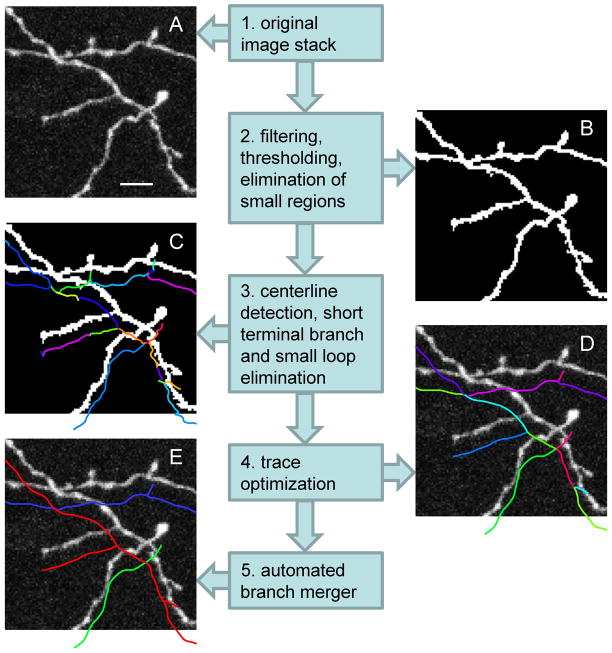
Figure 2.
Schematic illustration of the main steps of the automated tracing algorithm. A. Maximum intensity projection of a small part of an image stack containing GFP labeled mouse neocortical axons of layer 6 neurons (De Paola et al. 2006). Scale bar is 5 μm. B. Same image after the application of the CSF (Eq. 4, σ = 1 voxel size), intensity thresholding (at 25 out of 255), and elimination of small regions (less than 200 voxels in volume). C. Voxel coded binary image and the initial trace showing individual branches in different colors. Short terminal branches and small nested loops were removed. The trace is shifted down to improve visibility. D. The initial trace is optimized with two consecutive optimization algorithms. E. Result of the automated branch merger algorithm.

