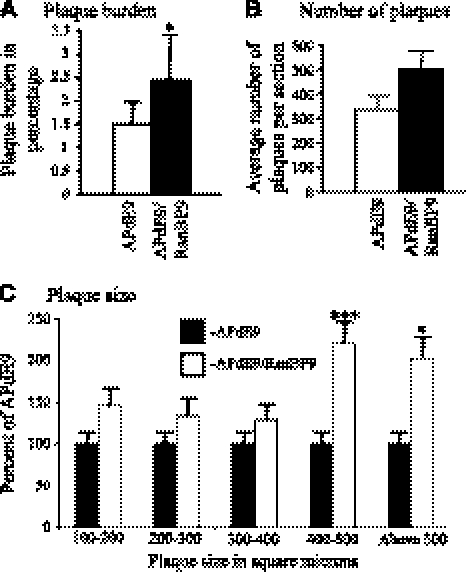
Figure 4.
Quantification of plaque burden and average number of plaques per section revealed increased plaque burden when RanBP9 is overexpressed. A) ImageJ quantification of plaque burden revealed 1.5% of the total brain area in APdE9 mice, which increased to 2.45% in APdE9/RanBP9 triple-transgenic mice. B) ImageJ quantification of average number of plaques per section showed 66% increase in plaque numbers in APdE9/RanBP9 triple-transgenic mice as compared to APdE9 double-transgenic mice. C) ImageJ analysis of plaque size (μm2) showed that RanBP9 increased plaques measuring 400–500 and >500 μm2 by121 and 103%, respectively, whereas plaques measuring 100–200 μm2 increased only by 46%, those of 200–300 μm2 by 34%, and those measuring 300–400 μm2 increased only by 29%. Five sections from each of 6 mice/group were used for plaque quantification. Data are presented as means ± se (n=6/group). *P < 0.05, ***P < 0.001; Student's t test.

