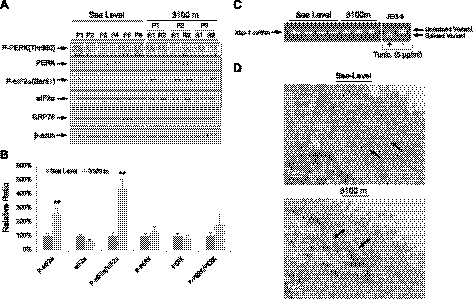
Figure 1.
Evidence of ER stress in placentas from high altitude. A) Phosphorylation of PERK and eIF2α and total protein level of PERK, eIF2α, and GRP78 were measured by Western blot analysis. β-Actin was used as loading control. B) Densitometric quantification of band intensity. Levels of phosphorylated and total protein are presented as a ratio to the sea-level control (100%). Data are means ± se from all 24 samples. **P < 0.01. C) Splicing of Xbp-1 mRNA was analyzed by RT-PCR; positive and negative controls were set up by treatment of the JEG-3 cells in the presence or absence of 5 μg/ml tunicamycin for 24 h. D) Electron microscopy showed dilation of ER cisternae at high altitude, but not at sea level. Arrows indicate ER cisternae. Scale bars = 500 nm.

