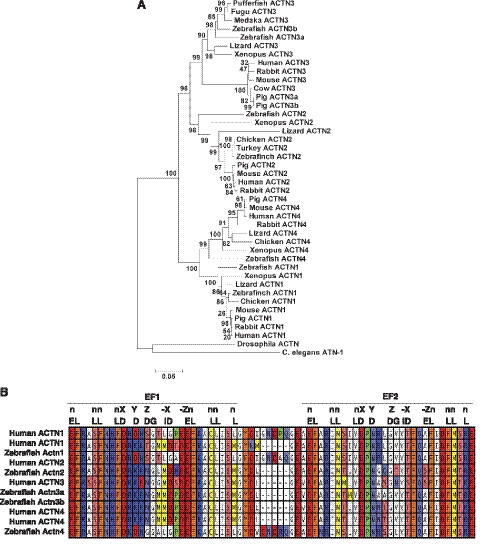
Figure 1.
The zebrafish genome encodes 5 α-actinins; 2 cytoskeletal and 3 sarcomeric isoforms. A) Phylogenetic analysis showing relationships between zebrafish α-actinins and other vertebrate α-actinins. Tree was constructed by neighbor-joining method. Numbers on nodes represent distance. Scale bar shows the distance scale and represents the number of differences between the sequences (25). B) Alignment of zebrafish and human EF-hand regions. E = E; L = L, I, F, V, M, A; D = D, N, E, Q, S, T; I = I, V; G =G. See Table 2 for quantification.

