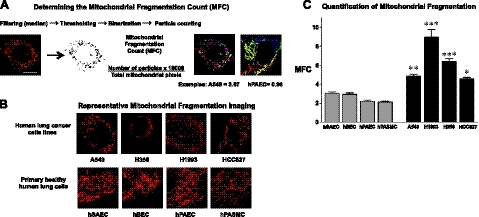
Figure 1.
Mitochondrial fragmentation in human lung cancer cells. A) Cells were loaded with mitochondrial red fluorescent dye TMRM and imaged with confocal microscopy to assess the mitochondrial network structure. The acquired images were background subtracted, filtered (median), thresholded, and binarized to identify mitochondrial segments using ImageJ. Continuous mitochondrial structures were counted with the particle counting subroutine, and the number was normalized to the total mitochondrial area (in pixels) to obtain the MFC for each imaged cell. For every cell line or intervention, ≥n = 25 randomly selected cells were imaged to calculate the respective MFC values. Scale bar = 10 μm (all images). B) Representative images of the mitochondrial imaging from cultured human lung cancer cell lines (A549, H358, H1993, HCC827) or human lung epithelial and vascular cells (hSAECs, hBECs, hPAECs, hPASMCs) shows a marked predominance of mitochondrial network fragmentation in the cancer cells. C) Quantification of the MFC confirms that all the lung cancer cells lines have a significantly higher level of mitochondrial network fragmentation that any of the nonmalignant human lung epithelial or vascular cells. *P < 0.05, **P < 0.01, ***P < 0.001 vs. nonmalignant cells; ANOVA with post hoc test.

