Figure 5.
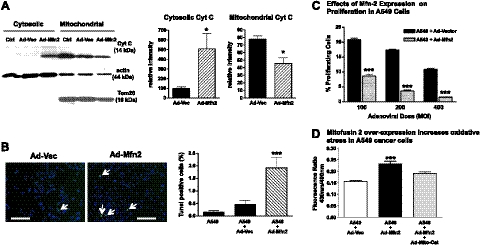
Mfn-2 gene therapy promotes apoptosis and suppresses proliferation in A549 cancer cells. A) Compartment-specific immunoblot analysis was performed to analyze the mitochondrial and cytosolic distribution of cytochrome c. Left panel: representative immunoblot demonstrates that Ad-Mfn-2 therapy induces mitochondrial apoptosis, as evidenced by redistribution of mitochondrial cytochrome c to the cytosolic fraction, when compared to untreated A549 cells (Ctrl) or A549 cells treated with an adenoviral control vector (Ad-Vec). Right panel: quantification of the normalized mean intensity for cytochrome c in mitochondrial and cytosolic compartments (means±se, n=4). *P < 0.05; t test. B) Induction of spontaneous apoptosis with Ad-Mfn-2 transfection in A549 cells was assessed using TUNEL staining. Left panel: representative immunofluorescence images show an increase in TUNEL-positive cells (arrows) with Ad-Mfn-2. Scale bars = 200 μm. Right panel: quantification confirms a marked increase in the percentage of TUNEL-positive cells (means±se, n=15). ***P < 0.001 vs. other treatments. C) Proliferation of A549 cells was determined by flow cytometric assessment of BrdU incorporation at 24 h following the transfection. Quantification demonstrates a dose-dependent effect of Ad-Mfn-2 (varying MOI on x axis) on the inhibition of cancer cell proliferation when compared to control transfected cells at 24h post-transfection (mean±se percentage of BrdU-positive cells on y axis, n=3). ***P < 0.001; t test. D) Cellular redox state was assessed using a roGFP construct. The y axis of the bar graph shows the redox ratio of cells treated with a control adenoviral vector, with adenoviral Mfn-2, or with the combination of adenoviral Mfn-2 and mitochondrial-targeted catalase. A higher redox ratio indicates a higher oxidation state (means±se, n≥5). ***P < 0.001.

