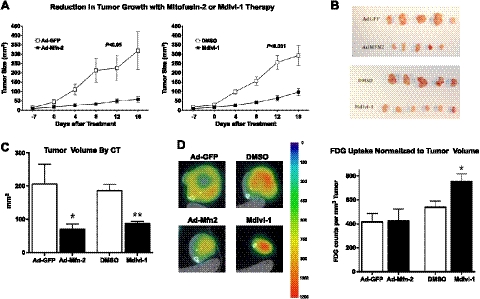
Figure 7.
Enhancing mitochondrial network formation suppresses tumor growth in vivo. A) Tumor size assessed over time in nude mice is shown as calculated volume (mm3; means±se, n=9/group). Therapeutic interventions were applied 2 wk after tumor implantation (d 0). Ad-Mfn-2 and mdivi-1 both prevented tumor progression (P<0.05 vs. control Ad-GFP and P<0.01 vs. control DMSO, respectively, by repeated measures ANOVA). B) Representative excised tumors from animals that were treated either with control therapies (Ad-GFP or DMSO) or the fusogenic therapies (Ad-Mfn-2, mdivi-1). C) Tumor volume (mm3 on y axis, n=9/group) was measured radiographically by micro-CT 2–3 wk post-therapy and demonstrated a significant decrease in tumor volume with Ad-Mfn-2 therapy or mdivi-1 treatment. *P < 0.05, **P < 0.01; t test. D) 18F-FDG uptake in implanted xenograft tumors was measured by PET; representative scans are shown for the respective treatment groups, and a color scale is attached to indicate the glucose uptake. Quantification of 18F-FDG uptake (18F-FDG counts/mm3, y axis) was normalized to tumor volume. No significant effect was found with Ad-Mfn-2 therapy on 18F-FDG uptake of the residual tumor, but an increase was found in 18F-FDG uptake of residual tumors in mdivi-1-treated tumors (means±se, n=9/group) *P < 0.05; t test.

