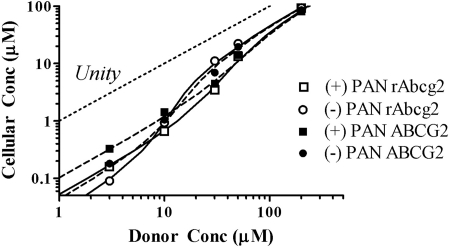
Fig. 5.
Predicted cellular concentration of PAN (eq. 10) relative to donor concentration based on PSD and PSPC described in Tables 1 and 2 and approximated values of PSAE (eqs. 8 and 9) were used. Squares, (+)PAN; circles, (−)PAN; open symbols, rAbcg2-MDCKII; closed symbols, ABCG2-MDCKII. The line of identity is provided as a reference.

