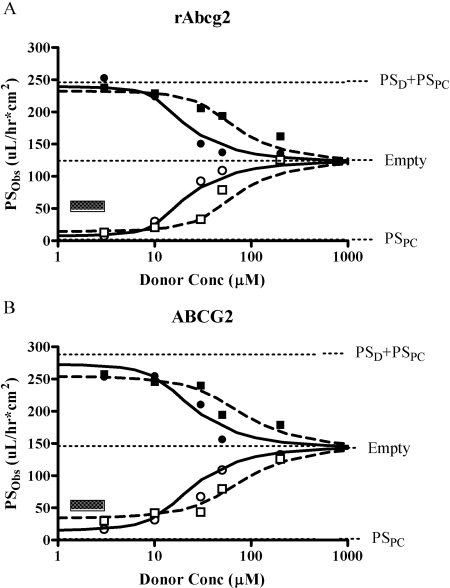
Fig. 7.
PSobs as a function of PAN donor concentration. A, rAbcg2. B, human ABCG2-MDCKII cell monolayer. Squares, (+)PAN; circles, (−)PAN; closed symbols, basolateral-to-apical flux; and open symbols, apical-to-basolateral flux. The simulation line represents eqs. 5 and 6 for basolateral-to-apical and apical-to-basolateral flux, respectively. Fitted parameters TMAX and KM (Table 3) were used to generate cellular concentration (eq. 10) and simulation of overall PSobs together with PSD and PSPC as described in Tables 1 and 2. Model limits for basolateral-to-apical (PSD + PSPC), apical-to-basolateral (PSPC), and empty cell line flux are presented for reference points. The small square box presents the range of PAN concentration in serum in rat or pharmacological concentration in human, respectively.

