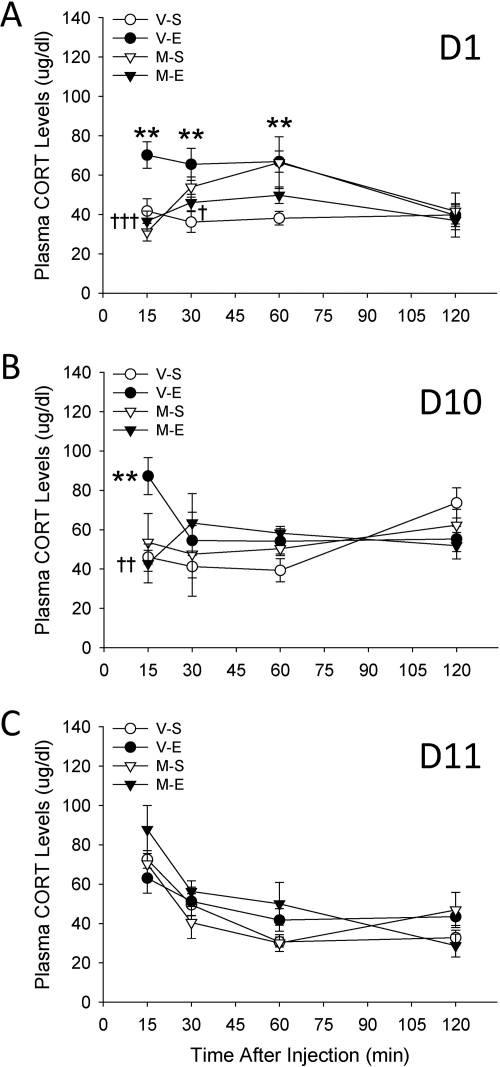
Fig. 4.
Metyrapone reduces EtOH (E)-induced increases in CORT levels. Shown are plasma CORT values (μg/dl; mean ± S.E.M) on days 1 (A), 10 (B), and 11 (C) (n = 7–10 per group). D2 mice were pretreated with vehicle (V) or 50 mg/kg of metyrapone (M) 30 min before receiving saline (S) or EtOH (1.5 g/kg) on 10 consecutive days. Then, on day 11, all animals received a vehicle-EtOH (1.5 g/kg) treatment. Each animal contributed a blood sample on days 1, 10, and 11, but blood samples were collected at 15, 30, 60, or 120 min after saline or EtOH from independent groups of mice. **, p < 0.01 for the comparison with the respective vehicle-saline group. †, p < 0.05, ††, p < 0.01, and †††, p < 0.001 for the comparison between metyrapone-EtOH and vehicle-EtOH groups.

