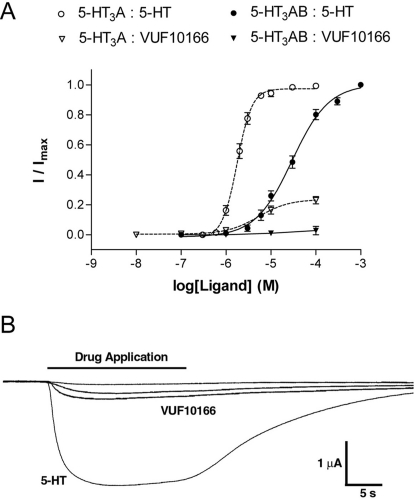
Fig. 7.
Agonist actions of 5-HT and VUF10166 at 5-HT3A and 5-HT3AB receptors. A, concentration-response curves showing the agonist response to 5-HT and VUF10166 at 5-HT3A receptors. VUF10166 activation of 5-HT3AB receptors was negligible (Rmax = 0.03 ± 0.02, n = 3). B, examples of traces at 1, 10, and 100 μM VUF10166 are compared with a maximal (30 μM) 5-HT response at 5-HT3A receptors. Parameters derived from these curves are shown in Table 1.

