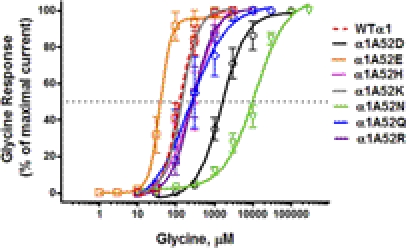
Fig. 1.
Concentration-response curves for glycine-activated chloride currents in X. laevis oocytes expressing WT and mutant α1GlyR subunits. Glycine-induced chloride currents were normalized to the maximal current activated by a saturating concentration of glycine (30 mM). The curves represent nonlinear regression analysis of the glycine concentration responses in the α1 mutant GlyRs compared with WT α1GlyRs. Details of EC50, Hill slope, and maximal current amplitude (Imax) are provided in Table 1. Glycine was applied for 30 s. Washout time was 5 to 15 min after the application of glycine. Each data point represents the mean ± S.E.M. from eight different oocytes.

