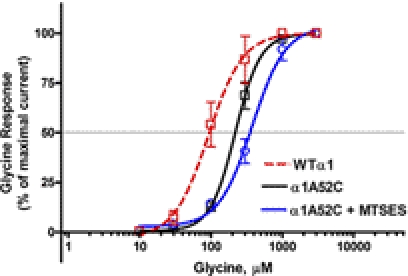
Fig. 3.
Concentration-response curves for glycine-activated chloride currents in X. laevis oocytes expressing WT and A52C mutant α1GlyR subunits exposed to MTSES. Mutant A52C GlyRs were exposed to the negatively charged MTSES. The curves represent nonlinear regression analysis of the glycine concentration responses from four different oocytes expressing WT (red), A52C (black), or A52C (blue) GlyRs. The introduction of negative charge at position 52 did not significantly affect agonist sensitivity. Each data point represents the mean ± S.E.M.

