Fig. 5.
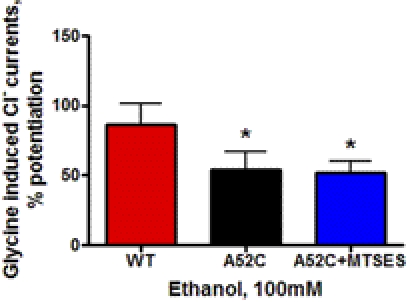
The effects of ethanol on WT and A52C mutant α1GlyRs exposed to MTSES. Mutant A52C GlyRs were exposed to the negatively charged MTSES. The red bar shows mean ± S.E.M. for WT, the black bar indicates A52C, and the blue bar indicates the A52C exposed to MTSES. The introduction of negative charge at position 52 using MTSES did not significantly affect ethanol sensitivity. *, p < 0.05 versus WT α1GlyRs for four oocytes per group.

