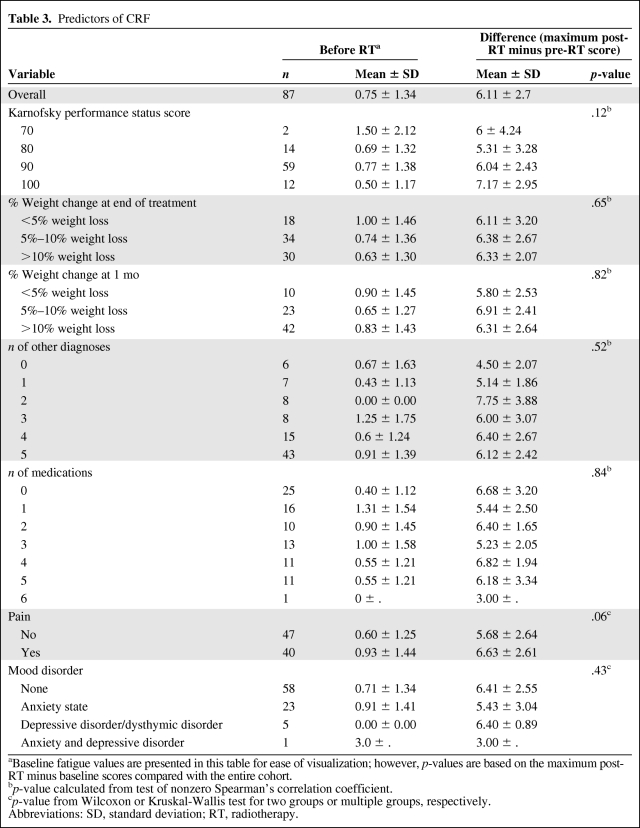
Table 3.
Predictors of CRF
aBaseline fatigue values are presented in this table for ease of visualization; however, p-values are based on the maximum post-RT minus baseline scores compared with the entire cohort.
bp-value calculated from test of nonzero Spearman's correlation coefficient.
cp-value from Wilcoxon or Kruskal-Wallis test for two groups or multiple groups, respectively.
Abbreviations: SD, standard deviation; RT, radiotherapy.

