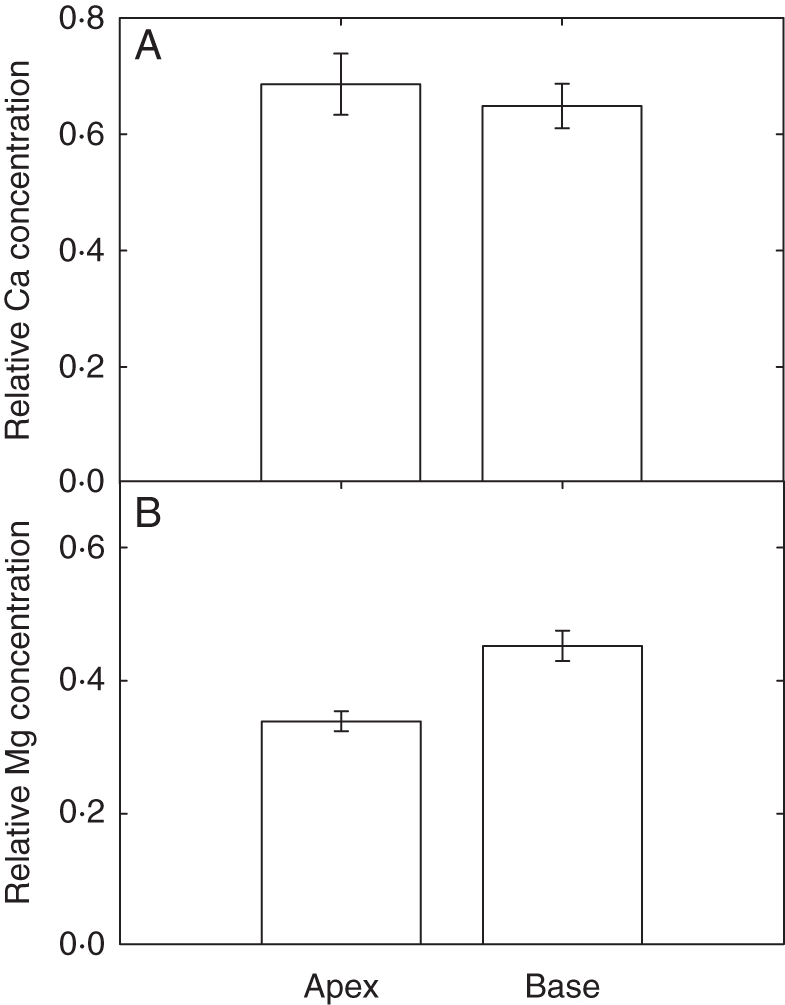
Fig. 3.

Relative concentrations of (A) Ca and (B) Mg at the apex and base of fully expanded leaves of 21-day-old Brassica rapa (R-o-18). Data represent the means (± s.e.m.) across all spectra (n = 10), cell types (n = 4) and Ca:Mg levels (n = 4) for three replicates (i.e. n = 480 in total).
