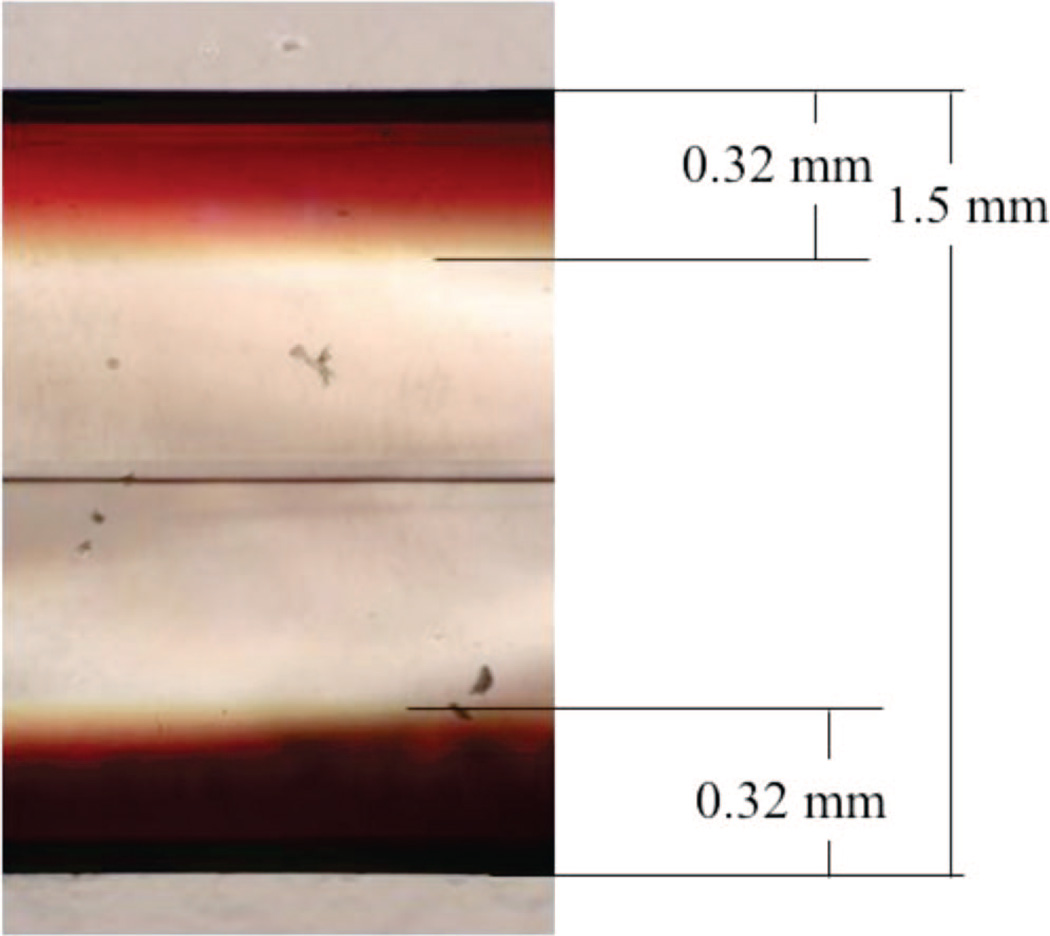
Figure 3.
A low-magnification (60×) cross-sectional optical image. The red areas indicate the depth of 1 accessed into PVG. The image shows 0.32 mm penetration depth on each face for 0.9 × 10⁻⁶ mol 1 adsorbed onto a 1.5 mm PVG sample. The horizontal line in the middle of the PVG sample corresponds to where two glass layers meet due to the commercial fabrication process.

