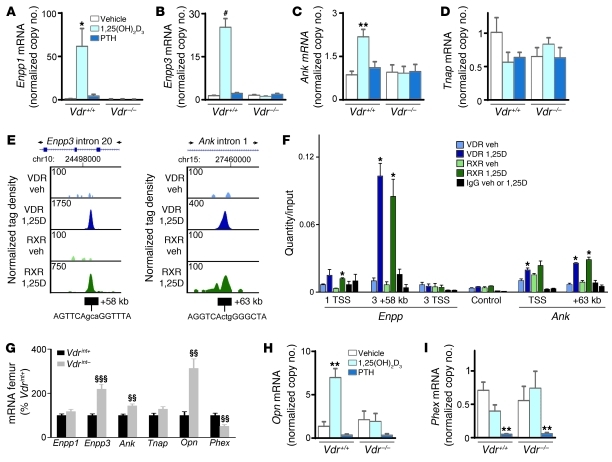
Figure 7. Molecular mechanism of 1,25(OH)2D-induced suppression of mineralization.
(A–D, H, and I) Gene expression analysis by qRT-PCR in in vitro–differentiated osteoblasts after treatment with vehicle, 10–8 M 1,25(OH)2D3, and 2.5 × 10⁻⁸ M PTH for 24 hours. Values denote mRNA copy number normalized to that of Hprt (see Methods). n = 6. (E) ChIP-seq tag density profiles for VDR (blue) and RXR (green) after treatment with vehicle or 10–7 M 1,25(OH)2D3 (1,25D) for 3 hours in MC3T3-E1 cells. Data centered around the Enpp3 and Ank peak genomic locus are shown, with arrows indicating the direction of gene transcription. ChIP-seq tag densities were normalized to 1 × 10⁷ tags; tag maximum for the data is shown at top left of each track. (F) qRT-PCR quantification of ChIP-DNA, obtained from MC3T3-E1 cells treated with vehicle or 1,25(OH)2D3 (10–7 M for 3 hours) prior to ChIP with VDR, RXR, and nonspecific IgG antibodies, with primers flanking the TSS of Enpp1 (1 TSS), the +58-kb peak in and the TSS of Enpp3 (3 +58kb and 3 TSS, respectively), the TSS of and the +63-kb peak in Ank, and a control sequence. Shown is 1 representative experiment of 3. (G) Femoral mRNA levels analyzed by qRT-PCR. n = 8. *P < 0.05, **P < 0.01, #P < 0.001 vs. vehicle-treated Vdr+/+, 1-way ANOVA followed by Fisher’s LSD multiple-comparison test; §§P < 0.01, §§§P < 0.001 vs. Vdrint+.

