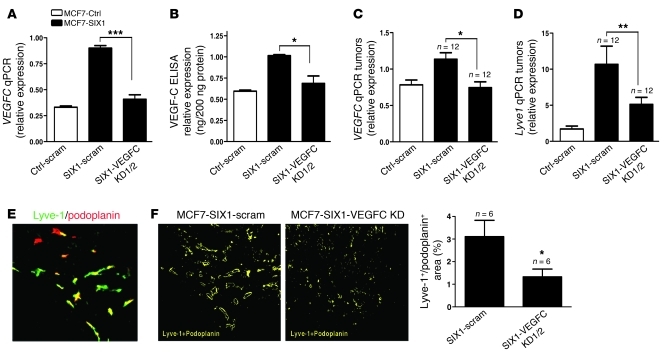
Figure 3. VEGF-C mediates SIX1-induced lymphangiogenesis.
(A) VEGFC expression in MCF7-Ctrl, MCF7-SIX1, and MCF7-SIX1-VEGFC KD cells was quantified by real-time PCR. Two shRNAs (VEGFC KD1 and VEGFC KD2; data regarding VEGFC KD1 and VEGFC KD2 are labeled VEGFC KD1/2 in the figure) were used to knockdown VEGF-C in MCF7-SIX1 cells, back to the level observed in MCF7-Ctrl cells. A scramble shRNA was introduced into MCF7-Ctrl (Ctrl-scram) and MCF7-SIX1 (SIX1-scram) cells to serve as a control. (B) Secreted VEGF-C in cultured medium from MCF7-Ctrl, MCF7-SIX1, and MCF7-SIX1-VEGFC KD cells was measured by ELISA. (C) VEGFC expression in MCF7-Ctrl, MCF7-SIX1, MCF7-SIX1-VEGFC KD tumors was quantified by real-time PCR. (D) Lyve1 expression in MCF7-Ctrl, MCF7-SIX1, MCF7-SIX1-VEGFC KD tumors was quantified by real-time PCR. (E) Representative image shows immunofluorescence for Lyve-1 (green) and podoplanin (red) in MCF7-SIX1 tumors. Original magnification, ×200. (F) SlideBook software was used to transfer the Lyve-1/podoplanin double-stained regions (as shown in E) in MCF7-SIX1 and MCF7-SIX1-VEGFC KD tumors to yellow signals as shown. Original magnification, ×200. Quantification of lymphatic vessels in MCF7-SIX1 and MCF7-SIX1-VEGFC KD tumors. *P < 0.05; **P < 0.01; ***P < 0.001.

