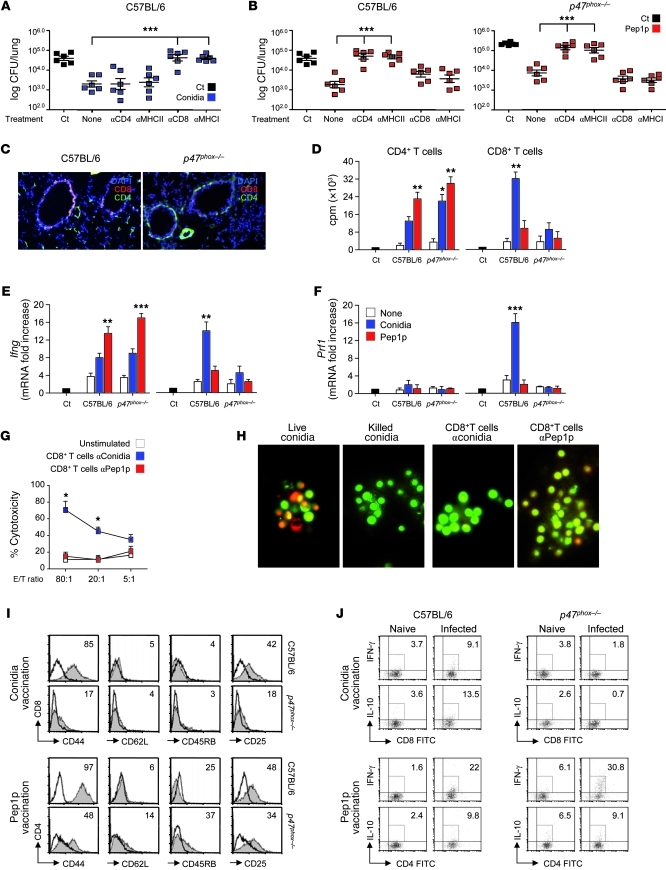
Figure 2. p47phox–/– mice fail to develop MHC class I–restricted CD8+ T cell responses to Aspergillus conidia.
Mice (6/group) received conidia or Pep1p plus CpG as described for Figure 1 and were concomitantly treated with the indicated antibodies or an isotype-matched control antibody (None). Fungal growth (log10 CFU ± SEM) in conidia-vaccinated (A) or Pep1p-vaccinated (B) mice at 3 days after reinfection. Control (Ct), infected, unvaccinated mice. Pooled data from 3 experiments are shown. (C) Lung immunohistochemistry 3 days after reinfection. Cell surface markers were Alexa Fluor 488–anti-CD4 and Alexa Fluor 647–anti-CD8 antibody. Cell nuclei were stained with DAPI (blue). Representative pictures (of 3 experiments) were taken with an original magnification of ×200. (D) Proliferation of CD4+ and CD8+ T cells purified from lungs 1 week after a primary i.n. infection. DNA synthesis was measured by 3H-thymidine uptake after 72 hours coculture with conidia- or Pep1p-pulsed DCs from the corresponding naive mice. Ct, T cells alone. Relative expression of (E) Ifng and (F) Prf1 by RT-PCR in CD4+ and CD8+ T cells exposed to conidia- or Pep1p-pulsed DCs for 24 hours. (G) Cytolytic activity of CD8+ T cells, obtained as in D, against conidia-pulsed DCs at different E/T ratios. Shown is the percentage of specific cytotoxic activity determined by a standard 4-hour 51Cr-release assay. (H) Conidiocidal activity of culture supernatants from CD8+ T cells exposed as in D (visualized with an original magnification of ×400). Activation/memory marker expression (I) and intracellular cytokine staining (J) by lung CD8+ and CD4+ T cells purified from conidia- or Pep1p-vaccinated mice, respectively, 3 days after reinfection. Histograms were generated from pooled samples of 6 mice/group. Representative histograms from a single experiment are shown. Values are the percentages of positive cells. *P < 0.05, **P < 0.01, ***P < 0.001 treated versus untreated mice (A and B) and pulsed DC–stimulated versus unstimulated cells (None) (D–G).

