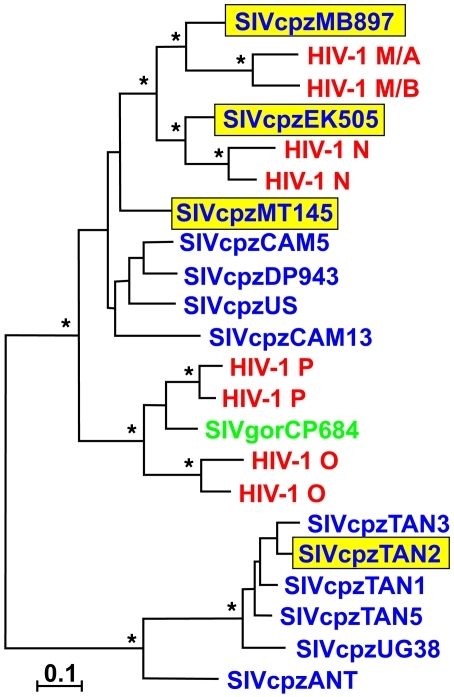
Figure 1. Evolutionary relationships of HIV-1 (including groups M, N, O, and P), SIVcpzPtt (upper clade) and SIVcpzPts (lower clade), and SIVgor Gag protein sequences, shown in red, blue, and green, respectively.
The 4 molecular clones of SIVcpz analyzed in this study are highlighted in yellow. The tree was constructed using maximum likelihood methods *Bootstrap support of greater than 80%. Scale bar: 0.1 amino acid replacements per site.

