
Fig. 10.
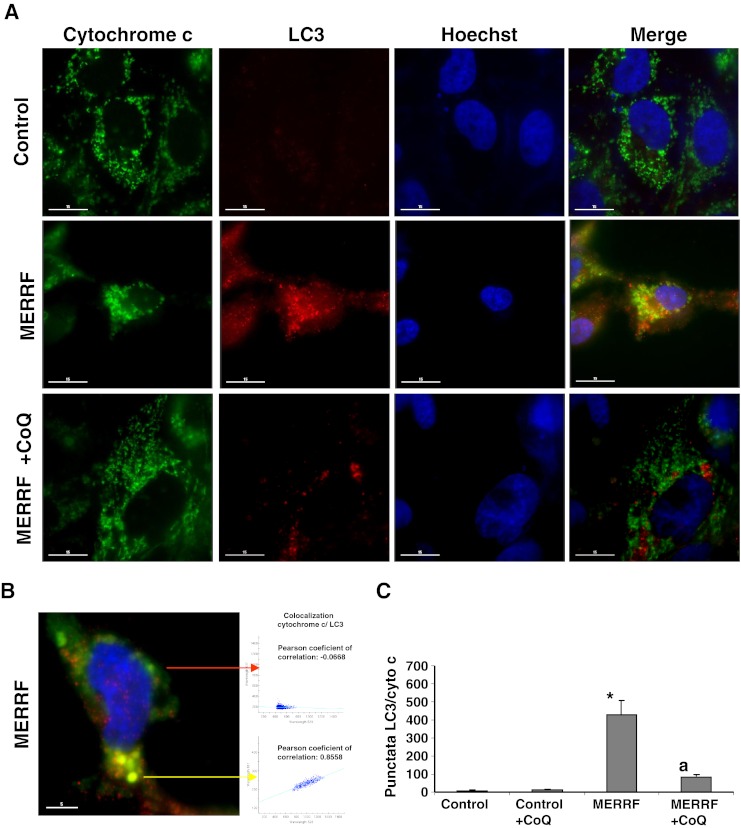
Image analysis of LC3 and cytochrome c immunostained control and myoclonic epilepsy with ragged-red fibers (MERRF) cybrids. (A) Fluorescent analysis of control and MERRF cybrids immunostained with anti-LC3 (autophagosome marker) and cytochrome c (mitochondrial marker) Colocalization of both markers was assessed by the DeltaVision software (Applied Precision, Issaquah, WA). (B) Magnification of a small area in a MERRF cybrid cell. Arrows show autophagolysosomes with LC3 and cytochrome c colocalization. The colocalization of both markers was assessed using DeltaVision software (Applied Precision). (C) Quantification of LC3/cytochrome c puntacta in control and MERRF cybrids incubated with or without 100 μM coenzyme Q10 (CoQ) (n = 100 cells). *p < 0.01 between control and mutant cybrids. ap < 0.01 between the presence and the absence of CoQ