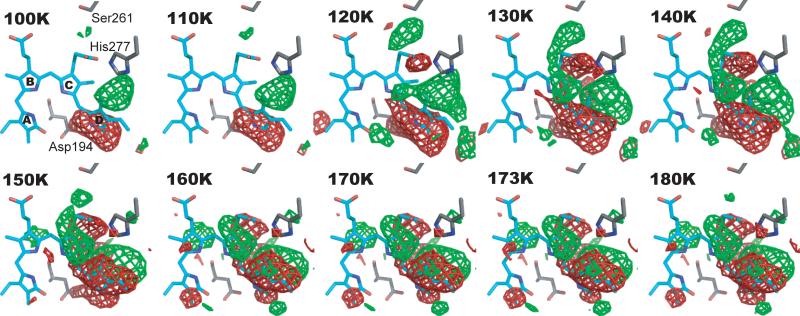
Fig. 2.
Difference maps (Flight-Fdark) at pump temperatures between 100 and 180K (contoured at +/- 4σ). The BV chromophore (cyan) is shown in the Pfr state. Positive (green) and negative (red) densities represent structural changes associated with formation of photoproduct state(s) and loss of the parent Pfr state, respectively. No significant difference densities with signal greater than +/-4σ are detected at longer range, beyond the 5Å radius around the chromophore.

