
Figure 1.

Proportion of variance explained by autosomal single-nucleotide polymorphisms (SNPs) for neuroticism (dark blue) and extraversion (light blue). Notes: all individuals included in the analyses have a pair-wise genetic similarity <0.025 except for the * marked in which no cutoff was made; the first 20 principal components (PC) were included as fixed effects in the model, except for the *** marked; error bars represent s.e.; PC; SNPs; UK and USA.**analyses based on 162 056 SNPs that were in common between all study cohorts; adjusted: estimate adjusted for imprecise LD between genotyped SNPs and causal variants for causal variants within the allelic frequency spectrum as genotyped SNPs, using the regression coefficient β from equation: 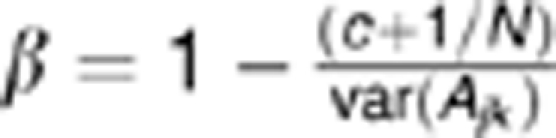 (assuming c=0), where Ajk is the variance of the off-diagonal elements of the genetic similarity matrix, N is the number of SNPs used to calculate Ajk. The value of c depends on the minor allele frequency of the causal variants.44 Further details and statistics are provided in Supplementary Table S2. Abbreviations: SNPs, single-nucleotide polymorphisms; UK, United Kingdom; USA, United States of America.