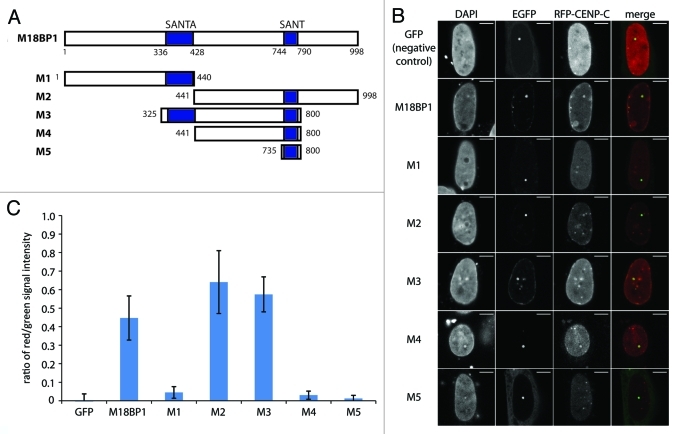
Figure 3. Mapping of the M18BP1-CENP-C interaction domains by F3H. (A) Scheme of M18BP1 truncations used in the interaction tests. (B) Representative F3H images of the negative control (GFP only) and EGFP tagged M18BP1 truncations tested with RFP-CENP-C. Overlap of red and green signals at the nuclear lacO focus indicates interaction. (C) Quantification of the F3H M18BP1-CENP-C interaction data. Intensities of red and green signals at the nuclear lacO focus were measured in several hundred cells each. The ratio between red and green signals was determined to measure the strength of the tested interactions.

An official website of the United States government
Here's how you know
Official websites use .gov
A
.gov website belongs to an official
government organization in the United States.
Secure .gov websites use HTTPS
A lock (
) or https:// means you've safely
connected to the .gov website. Share sensitive
information only on official, secure websites.
