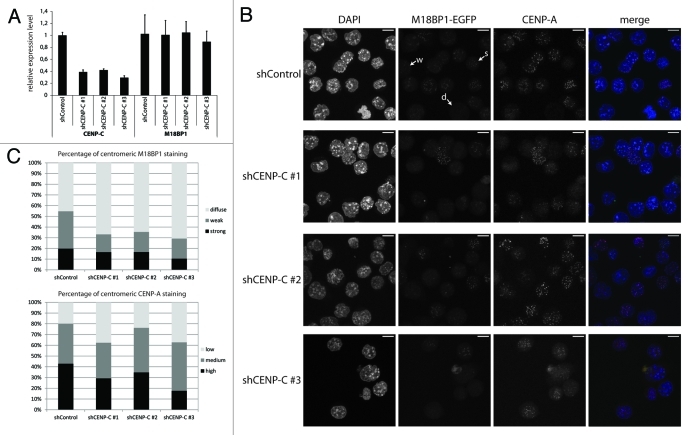
Figure 5. CENP-C knock-down leads to impaired centromeric recruitment of M18BP1. (A) RT-qPCR for CENP-C and M18BP1 five days after knock-down. Expression levels in the control knock-down cell line (shControl) and the three CENP-C knock-down cell lines (shCENP-C #1-#3) were normalized to the geometric mean of GAPDH and Actin. (B) Representative maximum intensity projections of confocal stacks of control and CENP-C knock-down cells that were stained for CENP-A. Arrows point to example cells for the three classes of M18BP1 signals: strong (s), weak (w) and no enrichment/diffuse nuclear (d). Scale bars are 10µm. (C) Quantification of the M18BP1 signals in control vs. CENP-C knock-down cell lines. M18BP1 and CENP-A staining patterns were classified in several hundred cells. The bar graph depicts the percentages of each class.

An official website of the United States government
Here's how you know
Official websites use .gov
A
.gov website belongs to an official
government organization in the United States.
Secure .gov websites use HTTPS
A lock (
) or https:// means you've safely
connected to the .gov website. Share sensitive
information only on official, secure websites.
