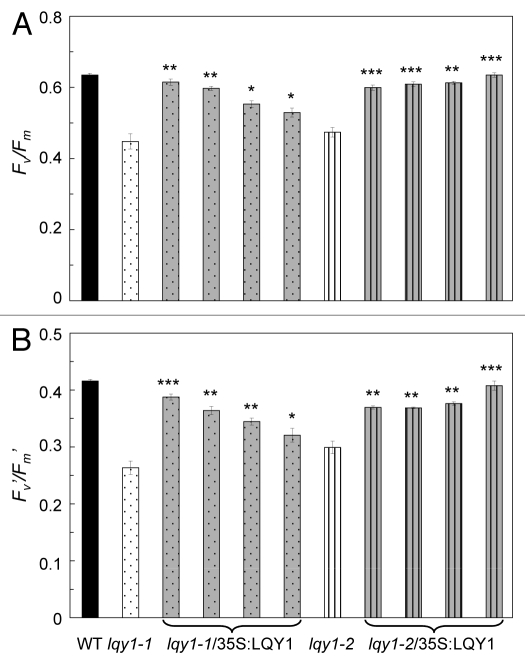
Figure 3.
PSII efficiency of lqy1 complementation lines. Fv/Fm (A) was measured after 20 min of dark adaptation. Fv’/Fm’ (B) was measured after 5 min of actinic exposure at 531 μmol photons m−2 s−1. Data from T2 generation are presented as mean ± SE (n = 4). Each bar represents a single insertion event at T1 generation. Black bars, wild-type empty vector control; white dotted bars, lqy1–1 empty vector control; gray dotted bars, representative complementation lines in lqy1–1 background; white striped bars, lqy1–2 empty vector control; gray striped bars, representative complementation lines in lqy1–2 background. The asterisks indicate significant difference between lqy1 complementation lines and the corresponding lqy1 mutant (Student’s t-test, *, p < 0.05; **, p < 0.01; ***, p < 0.001).

