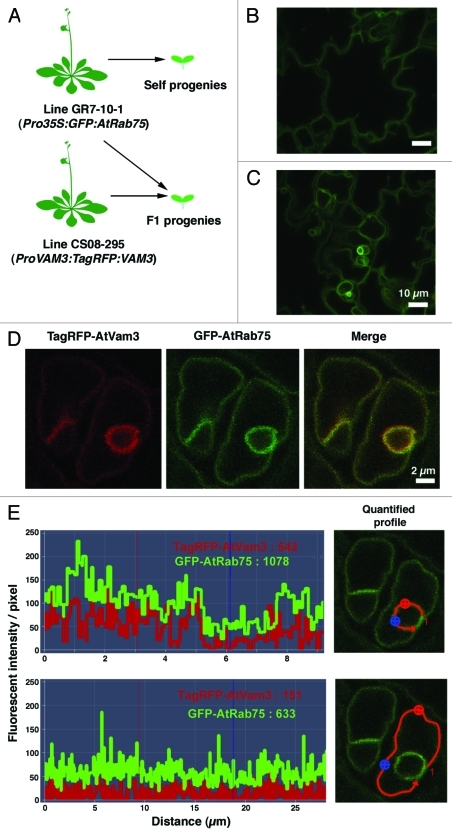
Figure 2. Dual color visualization of vacuolar membranes. (A) The generation of transgenic plants that express tagged proteins. (Top) Control self propagation is shown for the GR7–10–1 (Saito et al. 2002) plants. (Bottom) Cross-fertilization produced progeny that expressed both TagRFP:VAM3 and GFP:AtRab75. (B) Confocal laser scanning microscopic image of 3DAG cotyledon epidermal cells of plants produced by self progeny of GR7-10-1. (C) Confocal laser scanning microscopic image of 3DAG cotyledon epidermal cells of the F1 progeny of a cross between GR7-10-1 and ProVAM3:TagRFP:VAM3 marker plant lines. (D) Confocal laser scanning microscopic images of guard cells of the F1 progeny of a cross between GR7-10-1 and ProVAM3:TagRFP:VAM3 marker lines. (E) Quantification of fluorescent intensity/pixel in bulb membranes and peripheral vacuolar membranes. The areas quantified are indicated with red lines in the microscopic images on the right.

An official website of the United States government
Here's how you know
Official websites use .gov
A
.gov website belongs to an official
government organization in the United States.
Secure .gov websites use HTTPS
A lock (
) or https:// means you've safely
connected to the .gov website. Share sensitive
information only on official, secure websites.
