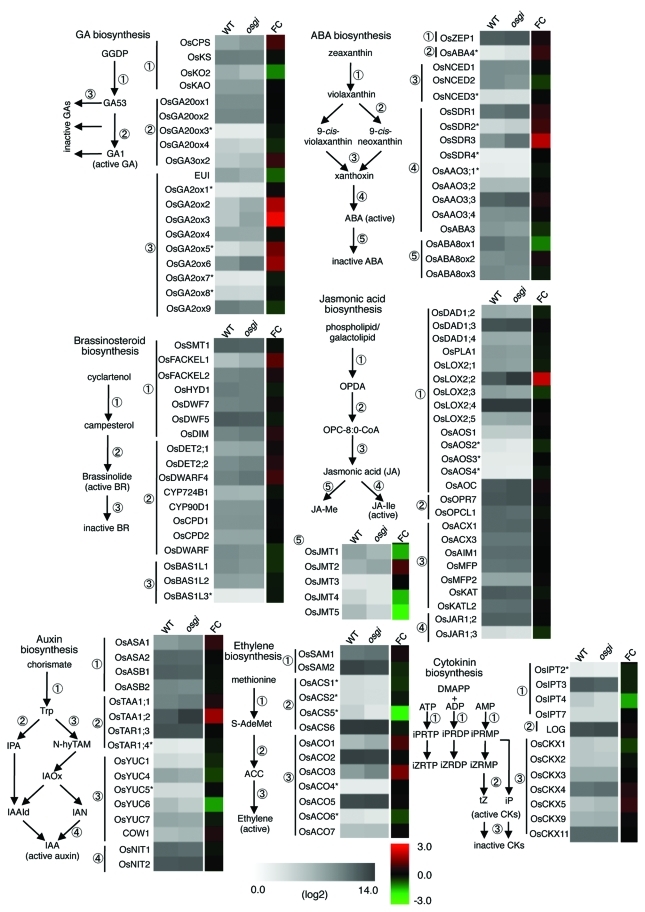
Figure 1.
Comparison of gene expression levels of phytohormone biosynthetic genes. Average mRNA levels during 24 h in the wild-type (WT) and osgi-1 plants are indicated as single color gradient. Their ratios (FC; fold change) between WT and osgi-1 are indicated as different color gradient. Red and green colors indicate higher and lower expression in osgi-1 mutant, respectively. A simplified view of each phytohormone biosynthetic pathway and genes involved in the indicated step are described in left sides of the expression data. Asterisks on right shoulder of gene name indicate that peaked expression level was lower than 26. Color gradient display was drawn by means of software, MeV_4_7.25

