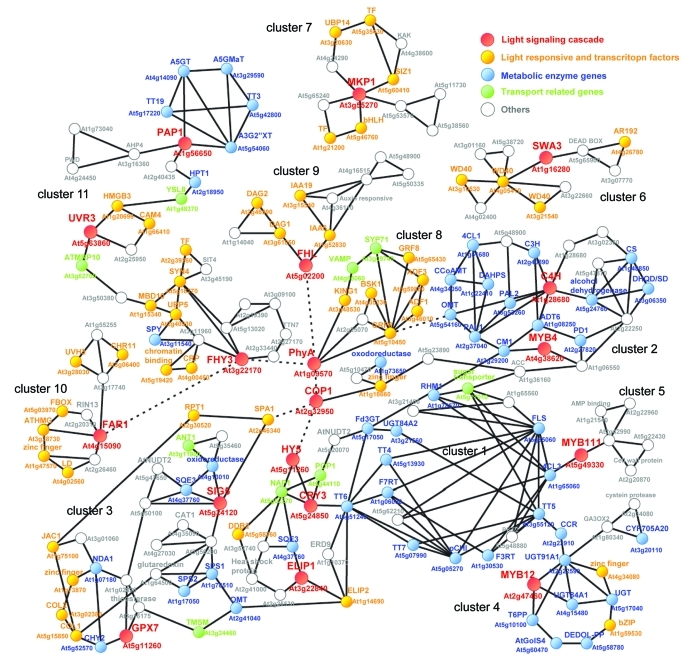
Figure 2.
Co-expression network analysis of light signaling related genes. Co-expression data obtained from ATTED-II version 6 (http://atted.jp/) was used in the construction of a co-expression network. Network analysis queried the 20 one light signaling cascade related genes shown in Figure 1A. Solid edges indicate gene co-expression, and red dotted edges indicate known protein-protein-interaction. Red node indicates light signaling cascade genes, yellow indicates putative light responsive and transcription factor genes, blue indicates genes encoding protectant metabolism, green indicates transport related genes.

