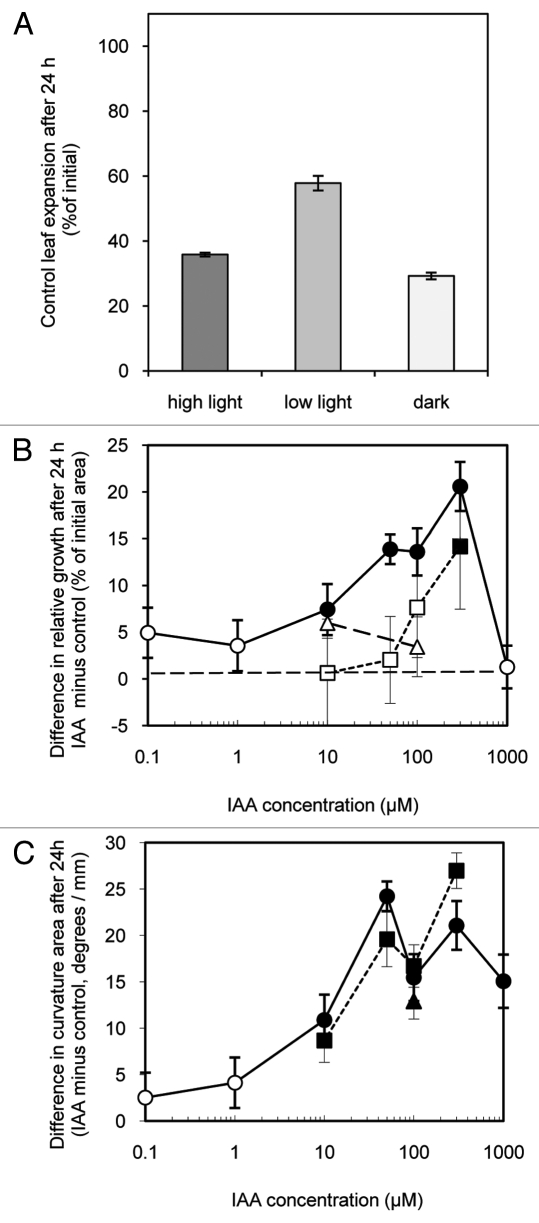
Figure 2.
Effect of light intensity and of IAA on the growth and epinastic curvature of leaf strips cut from expanding Arabidopsis leaves floated on either a control or IAA containing solutions in either high light (275 µmol s−1 m−2), low light (135 µmol s−1 m−2) or dark. Shown in A is growth (increase in area as % of initial area) of pooled control leaf strips. B shows the difference in relative growth between IAA treated and control leaf strips (i.e., the growth of each IAA treated strip minus that of the control strip from the same plant expressed as % of initial area) over 24 h in high light (●,○) low light (■,□) and dark (▲,Δ). C shows the difference (IAA treated minus control) in epinastic curvature (measured as the angle created by the tangent of terminal portion of each strip viewed in profile) expressed in degrees per mm of the same pairs of strips shown in B. Data are means +/− standard errors (n = 24). Significant differences (Student’s paired t-test) between IAA treated and controls leaf growth and curvature are indicated by filled symbols. Open symbols indicate no significant differences.

