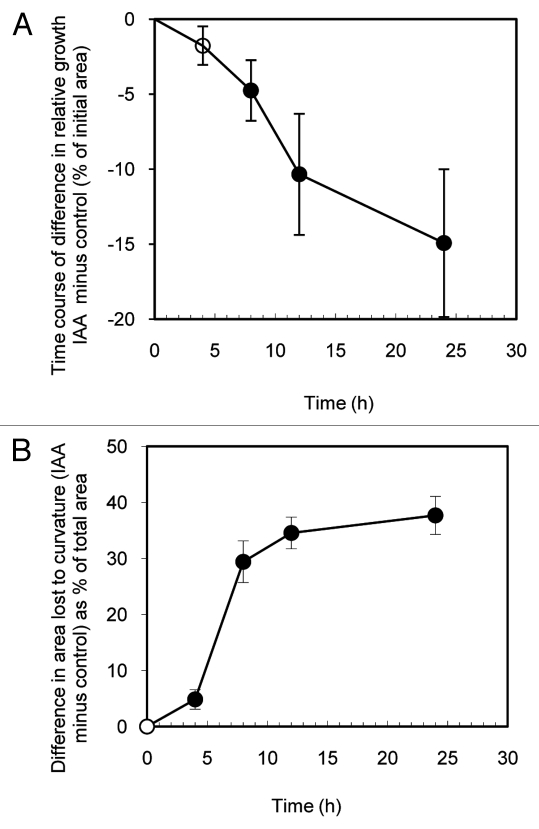
Figure 4.
Time course for IAA-induced growth inhibition (A) and development of epinasty (B). Shown in A is the difference in relative growth between IAA treated (50 µM) and control intact attached leaves (i.e., the growth of each IAA treated leaf minus that of the control leaf of the same plant expressed as % of initial area). For the same leaf pairs, B shows the difference (IAA treated minus control) in epinastic curvature as the difference in area before and after flattening expressed as % of the flattened area. Data are means +/− standard errors (n = 24). Significant differences (Student’s paired t-test) between IAA treated and controls leaf growth and curvature are indicated by filled symbols. Open symbols indicate no significant differences.

