Abstract
We report on the development of a compact multiphoton microscopy (MPM) system that integrates a compact and robust fiber laser with a miniature probe. The all normal dispersion fiber femtosecond laser has a central wavelength of 1.06 μm, pulse width of 125 fs and average power of more than 1 W. A double cladding photonic crystal fiber was used to deliver the excitation beam and to collect the two-photon signal. The hand-held probe included galvanometer-based mirror scanners, relay lenses and a focusing lens. The packaged probe had a diameter of 16 mm. Second harmonic generation (SHG) images and two-photon excited fluorescence (TPEF) images of biological tissues were demonstrated using the system.
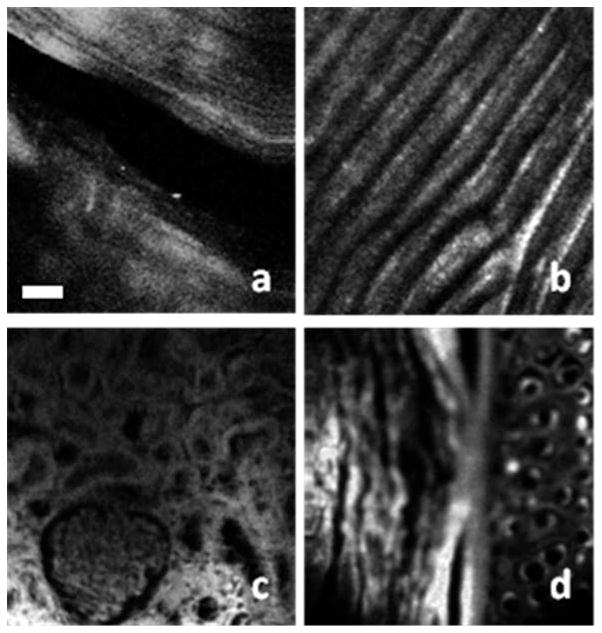
MPM images of different biological tissues acquired by the compact system which integrates an FBFP laser, an DCPCF and a miniature handheld probe.
Keywords: multiphoton processes, nonlinear microscopy, hand-held probe, fiber laser
1. Introduction
Multiphoton microscopes (MPM), which include two-photon excited fluorescence (TPEF) microscopy and second harmonic generation (SHG) microscopy, have been widely used for biological imaging with high contrast and submicron resolution [1, 2]. An MPM uses nonlinear optical interaction of biological molecules with a near-infrared, short pulse laser to provide deep tissue, 3D sectioning capability. Although an MPM provides a larger penetration depth compared to a confocal microscope, the penetration depth is limited to around 600 μm for typical multiphoton systems which use the Ti: Sapphire femtosecond (fs) laser with an excitation wavelength of around 800 nm and repetition rate of around 80 MHz. Imaging depth of MPM may be increased by increasing the average power, decreasing the pulse width or decreasing the repetition rate of the laser. A more effective strategy to increase the imaging depth is by using a longer excitation wavelength [3–5].
Successful clinical application of optical imaging systems, such as optical coherent tomography, is attributed partially to their fiber-based implementation which makes the system compact and portable. For the clinical application of MPM systems, the compact and portable feature is essential. Ti: Sapphire-based MPM systems are usually bulky and difficult to transport. Several new kinds of fs laser sources are emerging, such as the passive mode-locking lasers using saturated Bragg reflectors, the optically pumped semiconductor laser, and optical parametric oscillators [6]. There have been a number of drawbacks that prevent these lasers from becoming widely used MPM laser sources [6]. The fiber-based femtosecond-pulsed (FBFP) laser is a promising source for MPM applications because the FBFP laser is compact and robust. Furthermore, an FBFP laser could provide wavelength tunability based on soliton frequency shift in special fibers, such as a highly nonlinear fiber and a higher order mode fiber [7, 8]. Finally, an FBFP laser is more suitable for compact and endoscopic applications because the fiber output feature allows direct coupling with fiber-based systems.
Efficient generation of a nonlinear signal requires focus of the excitation laser in both space and time. Fiber-based femtosecond-pulse (FBFP) sources that can deliver short fs pulses (<100 fs) at a high repetition rate (100 MHz) with relatively large average power (>500 mW) are essential for moving this technology from bench top to bed side. Although MPM systems based on commercially available FBFP lasers have been demonstrated by several groups [9–11], none of them have demonstrated a fiber-based probe combined with a fiber laser source.
In vivo MPM imaging will limit average power on biological tissue to less than 50 mW due to safety considerations and there are a few commercial sub 100 fs fiber lasers with an average power that approaches 50 mW. However, a fiber-based endoscopic MPM or an MPM with a handheld probe requires a fiber fs laser with a much higher average power because prechirping for dispersion control, coupling to the fiber, and probe optics all contribute to power loss. Assuming the following efficiency values (pre-chirping unit, 60%; coupling to fiber, 40%; and probe optics, 70%), there is an overall efficiency of 17%. Therefore, a fiber fs laser with pulse width of sub 100 fs, and an average power of larger than 300 mW will be an ideal source for endoscopic MPM applications. Such a source is currently not commercially available. Recently, Dr. Wise group reported a FBFP laser with pulse width of 80 fs and an average power of more than 2 W [12].
In this paper, we report the development of a compact multiphoton microscopy system which integrates an FBFP laser, a double clad photonic crystal fiber (DCPCF) and a miniature handheld probe. The laser occupies a space of 60 × 45 × 24 cm, and it can be condensed into a much smaller space. The laser produces a 125 fs pulse width and more than 1 W average power. The DCPCF guarantees effective delivery of fs excitation pulse and efficient collection of multiphoton signals via its large diameter core and a high numerical aperture (NA) clad. The hand-held probe has a diameter of 16 mm.
2. Experimental setup
2.1 System setup
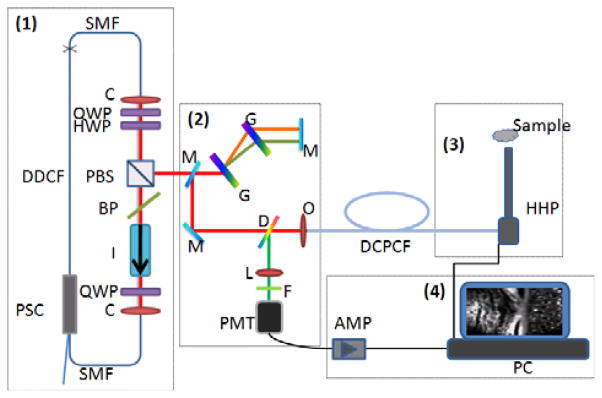
Figure 1 shows the schematic of this MPM system. The fiber-based MPM system includes four parts: (1) the FBFP laser, (2) the dispersion compensation, fiber coupling and detection system, (3) the hand-held probe, and (4) the data acquisition and displaying system. We will elaborate on each part in the following sections.
Figure 1.
(online color at: www.biophotonics-journal.org) Schematic of the compact MPM system with handheld probe. PSC: pump/signal combiner; DDCF: doped double clad fiber; SMF: single mode fiber; C: collimator; QWP: quarter wave plate; I: isolator; BP: birefrigent plate; PBS: polarization beam splitter; HWP: half wave plate; M: mirror; G: grating; D: dichroic beam splitter; L: lens; F: filter; O: objective; PMT: photon multiplier tube; AMP: low noise preamplifier; DCPCF: double clad photonic crystal fiber; HHP: handheld probe; PC: personal computer.
2.2 Fiber laser
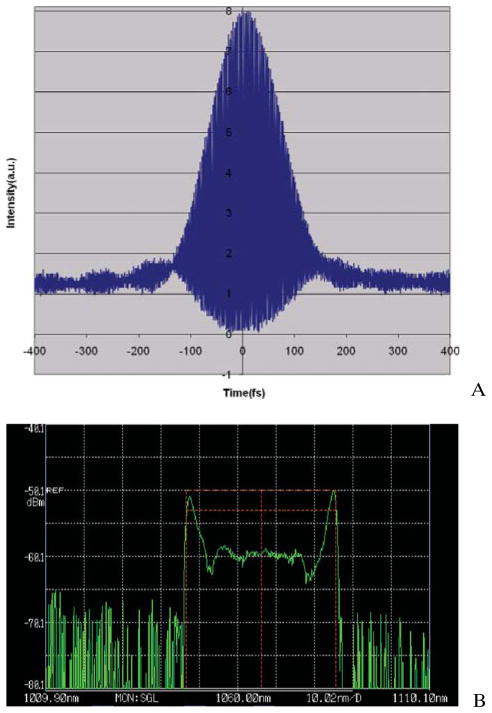
The schematic of the cladding-pumped FBFP laser source is shown in Figure 1 [12]. The pump laser has a central wavelength of 976 nm and a maximum power of 20 W. The pump power is delivered to the inner clad of the double clad (DC) gain fiber through a home-built pump-signal combiner. The Yb-doped DC gain fiber (Liekki DC1200-10/125) has a core diameter of 10 μm and inner clad diameter of 105 μm. We improved the laser performance further by using a larger core (10 μm), single mode passive fiber instead of the 6 μm passive fiber. The 10 μm diameter core fiber matches the core diameter of the doped double clad gain fiber and thus reduces the splice loss. Stable mode locking is achieved by tuning the waveplates. The dechirped output pulse has a pulse width of 125 fs (Figure 2a), a wavelength bandwidth of 38.9 nm (Figure 2b) and a pulse repetition rate of 76 MHz. The average power after dechirping is more than 1.2 W when the pump power is around 7.5 W, and higher output power is possible by increasing the pump power. The FBFP laser is compact and could be transported easily.
Figure 2.
(online color at: www.biophotonics-journal.org) (A) Autocorrelation trace of the dechirped pulse, (B) output spectrum.
2.3 Dispersion compensation, fiber coupling and detection
The output from the fiber laser is delivered to the dispersion compensation stage, the fiber coupling and detection system. The dispersion compensation stage consists of two highly efficient transmission gratings and several mirrors. One of the transmission gratings and a mirror are mounted on a translational stage so that the system dispersion is adjustable. Recently, double cladding fibers (DCF) based devices have been widely used for fluorescence imaging and nonlinear microscopic imaging [13–15]. The DCF is interesting because it can deliver the excitation beam in the inner core and collect the signal with a larger cladding. We used a DCPCF for this purpose. The fiber (DC-165-16-Passive, NKT Photonics A/S, Denmark) has a core diameter of 16 μm and an inner clad diameter of 163 μm, respectively [13]. It provides a single mode operation in the core for optical wavelength longer than 700 nm. Its large core diameter greatly reduces the nonlinear effect, and its high NA clad guarantees high signal collection efficiency. The detection efficiency of the DCPCF-based microscope is 40 times more than that of the normal single-mode fiber [13]. The length of the fiber is 1 meter. The laser beam after passing through the grating pair was coupled into the core of the DCPCF with a 4× objective. The dispersion induced by the DCPCF was compensated by tuning the distance of the grating. The fiber output tip was provided with a SMA connector, which enabled easy connection and disconnection from the handheld probe. The collected multiphoton signal by the DCPCF is reflected by a dichroic mirror (Chroma Technology, 880dcxxr). The reflected signal was sent into a photomultiplier tube (PMT) after passing through a focusing lens and band-pass filter (Chroma Technology, e820sp, passing band from 425 nm to 850 nm). For SHG signal detection, another bandpass filter was also added in front of the PMT. The SHG band pass filter had a central wavlength of 534 nm and a bandwidth of 20 nm (Semrock, FF01-534/20-25). For TPEF detection, the SHG bandpass filter was replaced by a long pass filter (Semrock, LP03-532RS-25, pass band from 544.2 nm to 1200 nm), so that the effective detection wavelength range for TPEF was 544.2 nm to 850 nm. The PMT detected signal was further amplified by a low noise preamplifier. The amplified signal was sent to a data acquisition board on a personal computer (PC).
2.4 Handheld probe design
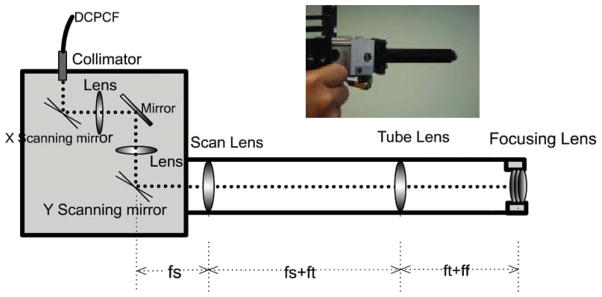
A schematic of the handheld probe is shown in Figure 3, and the inset shows a photograph of the packaged handheld probe. The handheld probe includes a collimator, two-axis galvanometer-based mirror scanners, two relay lenses and a customized focusing lens. The DCPCF is connected to the collimator of the probe by a SMA fiber connector. The collimator has a focal length of 18 mm which makes a collimated beam around 1.8 mm in diameter. The relay lenses include a 30 mm focal length scan lens and a 50 mm focal length tube lens. The two lenses are arranged to form a telescope which also serves as a 1.67× beam expander. The distance between the scan lens and the scanning mirror is equal to the focal length of the scan lens (30 mm, in this case). Both of the two relay lenses have diameters of 12.7 mm. The customized focusing lens has a NA of 0.65 and a diameter of 15.3 mm for the lens package. The diameter for the whole packaged lens system is 16 mm.
Figure 3.
(online color at: www.biophotonics-journal.org) Schematic and photograph of the handheld probe. fs: focusing distance of the scan lens; ft: focusing distance of the tube lens; ff: focusing length of the focusing lens.
2.5 Data acquisition and software
The data acquisition and displaying system includes a preamplifier and a personal computer workstation. The image acquisition and processing software is written with Microsoft Visual C++ 6.0. The X-axis galvanometer mirror scanner is driven by a sawtooth waveform for a period of 1 ms, and the Y-axis galvanometer mirror scanner is driven by a sawtooth waveform for a period 512 ms. Both the X- and Y-driving voltages are output from a multifunctional card (PCI6115, National Instruments, Austin, TX). The signal from the preamplifier is acquired and digitized by the same multifunctional card. Driving waveform outputs and analog signal acquisition are synchronized in the software. Data was processed in real-time and displayed in a 512 × 512 pixels image at a frame rate of 2 frames per second.
3. Results
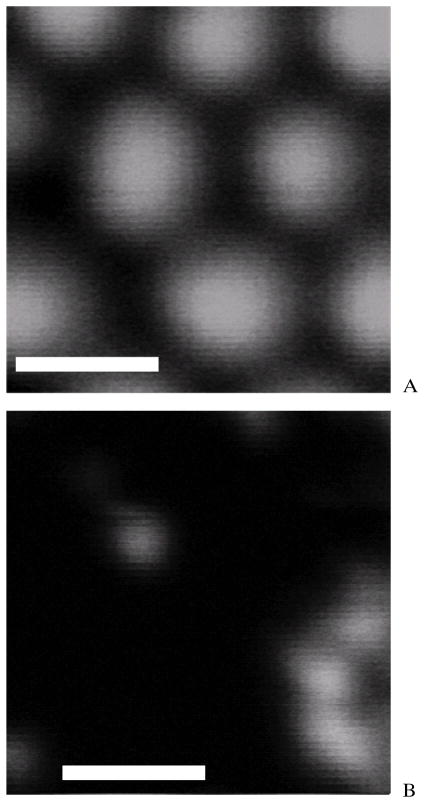
The resolution of this compact MPM system was tested with fluorescent beads of different sizes (4 μm and 1 μm diameter beads; Red Fluorescence, Invitrogen Corporation, Carlsbad, CA). The average output power used in these measurements was approximately 5 mW. Fluorescent beads solvent was deposited on a cover glass. The solvent was kept at room temperature for hours until it dried out, and only beads were left on the cover glass. Figure 4(a) shows the TPEF image for the 4 μm diameter fluorescent beads. Figure 4(b) shows the image of the 1 μm diameter fluorescent beads. Blurring of the beads images in the figure shows that the optimal resolution of the system was reached. The full width at half-maximum (FWHM) of the Gaussian fitting of the bead images was found to be around 1.6 μm. This means that the system’s radial resolution was 1.6 μm. The current setup was not able to provide z-axis scanning capability. A possible way for z-axis scanning capability is still under investigation. The z-axis resolution was measured to be around 5 μm by moving the bead sample along the z-axis direction with a translation stage. The resolution is lower than theoretical resolution. This is because the aperture of the focusing lens is under-filled in the current setup. The resolution could be increased further by a higher NA focus lens or higher magnification beam expander.
Figure 4.
(A) TPEF images of fluorescent beads acquired by the system: 4 μm diameter fluorescent beads. Scale bar: 4 μm. (B) TPEF images of fluorescent beads acquired by the system: 1 μm diameter fluorescent beads. Scale bar: 4 μm.
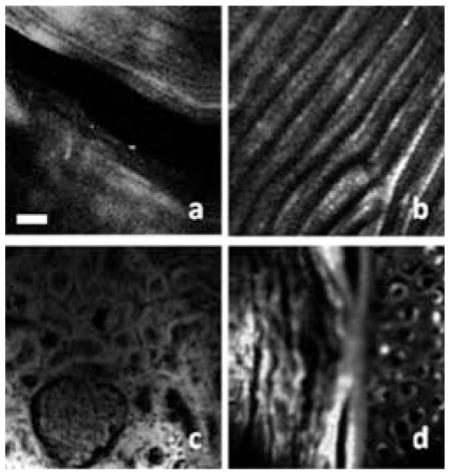
To further test the MPM system, we imaged the biological samples with the compact system and handheld probe. Figure 5 shows the MPM images of different biological tissues. Figures 5a and 5b are the SHG images of rat tail tendon and fish scale. These images reveal the intrinsic SHG signals from the sample. The tail was removed from a rat sacrificed for another experiment and was frozen for hours before our experiment. The rat tail tendon was removed from the thawed rat tail and imaged. Scales were plucked from live fish and kept at room temperature for hours before experiment. The laser power on the samples was around 60 mW. The image size was 200 × 200 μm. The collagen fibers can be identified in the SHG images. Hematoxylin and eosin (H&E) staining is the standard method for pathological investigations. Eosin is a pinkish-red dye which has a typical one photon absorption peak at 527 nm (www.anaspec.com). Recently, investigation of H&E sections using a nonlinear microscope has been demonstrated [16]. Here, we demonstrated the TPEF capability of our fiber-based compact MPM system with H&E staining sample. Figures 5c and 5d show the TPEF images of rabbit kidney and rabbit ear. Samples were prepared by standard histology technology and stained with H&E. Investigating intrinsic TPEF from biological tissues is very important and MPM with a longer wavelength beyond 1 μm can increase imaging depth [3, 4]. Intrinsic TPEF of biological tissues with longer excitation wavelength beyond 1 μm may be tens of times weaker than those with shorter excitation wavelength of around 880 nm [17]. In-vivo imaging of intrinsic TPEF signal with a longer excitation wavelength requires further investigation.
Figure 5.
MPM images acquired by the compact system: (a) SHG image of rat tail tendon; (b) SHG image of the fish scale; (c) TPEF image of rabbit kidney; (d) TPEF image of rabbit ear. Scale bar: 25 μm.
4. Conclusions
In conclusion, we have developed a compact MPM system that integrates a compact and robust fiber laser with a miniature DCPCF-based handheld probe. The whole system is compact and can be easily transported or relocated without major optical realignment. Micrometer resolution was obtained with the system. SHG and TPEF images of tissues were demonstrated with the system.
Acknowledgments
The authors acknowledge Leacky Liaw and Linda Li for their help in TPEF sample preparation. This work was supported by the National Institutes of Health (EB-00293, CA-91717, EB-10090, RR-01192), Air Force Office of Scientific Research (FA9550-04-0101), and the Beckman Laser Institute Endowment.
References
- 1.Denk W, Strickler JH, Webb WW. Science. 1990;248:73–76. doi: 10.1126/science.2321027. [DOI] [PubMed] [Google Scholar]
- 2.Helmchen F, Denk W. Nat Methods. 2005;2:932–940. doi: 10.1038/nmeth818. [DOI] [PubMed] [Google Scholar]
- 3.Kobat D, Durst ME, Nishimura N, Wong AW, Schaffer CB, Xu C. Opt Express. 2009;17:13354–13364. doi: 10.1364/oe.17.013354. [DOI] [PubMed] [Google Scholar]
- 4.Balu M, Baldacchini T, Carter J, Krasieva TB, Zadoyan R, Tromberg BJ. J Biomed Opt. 2009;14:010508. doi: 10.1117/1.3081544. [DOI] [PMC free article] [PubMed] [Google Scholar]
- 5.Sun C, Chen C, Chu S, Tsai T, Chen Y, Lin B. Opt Lett. 2003;28:2488–2490. doi: 10.1364/ol.28.002488. [DOI] [PubMed] [Google Scholar]
- 6.Girkin J. In: Handbook of Biomedical Nonlinear Optical Microscopy. Masters BR, So PTC, editors. Oxford Univ. Press; New York: 2008. pp. 191–216. [Google Scholar]
- 7.Howe JV, Lee JH, Zhou S, Wise F, Xu C, Ramachandran S, Ghalmi S, Yan MF. Opt Lett. 2007;32:340–342. doi: 10.1364/ol.32.000340. [DOI] [PubMed] [Google Scholar]
- 8.Lim H, Buckley J, Chong A, Wise FW. Electron Lett. 2004;40:15231–525. [Google Scholar]
- 9.Millard AC, Wiseman PW, Fittinghoff DN, Wilson KR, Squier JA, Müller M. Appl Optics. 1999;38:7393–7397. doi: 10.1364/ao.38.007393. [DOI] [PubMed] [Google Scholar]
- 10.Unruh JR, Price ES, Molla RG, Stehno-Bittel L, Johnson CK, Hui R. Opt Express. 2006;14:9825–9831. doi: 10.1364/oe.14.009825. [DOI] [PubMed] [Google Scholar]
- 11.Tang S, Liu J, Krasieva TB, Chen Z, Tromberg BJ. J Biomed Opt. 2009;14:030508. doi: 10.1117/1.3153842. [DOI] [PMC free article] [PubMed] [Google Scholar]
- 12.Kieu K, Renninger WH, Chong A, Wise FW. Opt Lett. 2009;34:593–595. doi: 10.1364/ol.34.000593. [DOI] [PMC free article] [PubMed] [Google Scholar]
- 13.Fu L, Gan X, Gu M. Opt Express. 2005;13:5528–5534. doi: 10.1364/opex.13.005528. [DOI] [PubMed] [Google Scholar]
- 14.Ryu SY, Choi HY, Na J, Choi ES, Lee BH. Opt Lett. 2008;33:2347–2349. doi: 10.1364/ol.33.002347. [DOI] [PubMed] [Google Scholar]
- 15.Bao H, Ryu SY, Lee BH, Tao W, Gu M. Opt Lett. 2010;35:995–997. doi: 10.1364/OL.35.000995. [DOI] [PubMed] [Google Scholar]
- 16.Tuer A, Tokarz D, Prent N, Cisek R, Alami J, Dumont DJ, Bakueva L, Rowlands J, Barzda V. J Biomed Opt. 2010;15:026018. doi: 10.1117/1.3382908. [DOI] [PubMed] [Google Scholar]
- 17.Rimke I, Büttner E, Andresen V, Friedl P. Proc SPIE 6442. 2007:64420O/1–64420O/8. [Google Scholar]


