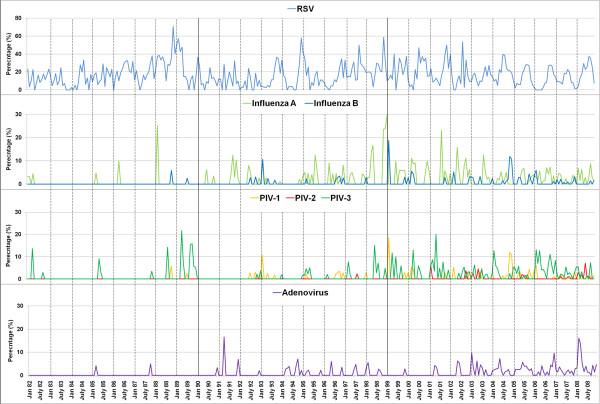
Figure 2.
Monthly activity pattern of respiratory viruses between 1982 and 2008. The detection of respiratory viruses in each month was plotted over 27 years demonstrating the seasonal trends over the years. The percentage rates of detection of each virus (divided by the total number of samples positive for any respiratory virus) are shown.

