
Figure 2.
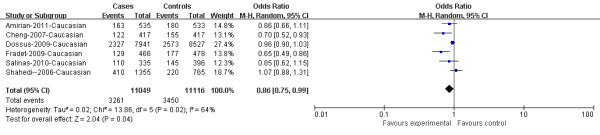
Cox-2 rs2745557 was associated with a lower PCa risk under dominant model in Caucasians (TT + TC versus CC). The squares and horizontal lines correspond to the study specific OR and 95% CI. The area of the squares reflects the weight (inverse of the variance). The diamond represents the summary OR and 95% CI.