Figure 3.
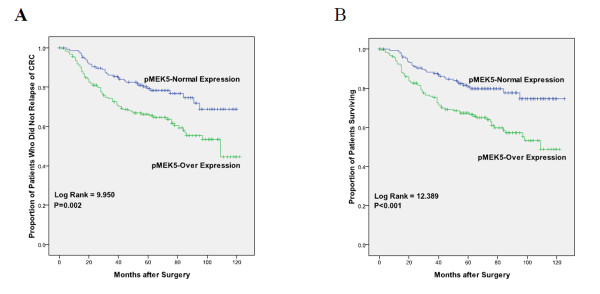
Survival analysis of primary CRC patients (n = 335). Kaplan-Meier estimates of the DFS (A) and OS (B) according to pMEK5 expression in 335 patients. The DFS and OS were significantly lower in patients with pMEK5 overexpression when compared with patients who had normal pMEK5 expression. P values were calculated using the log-rank test.

