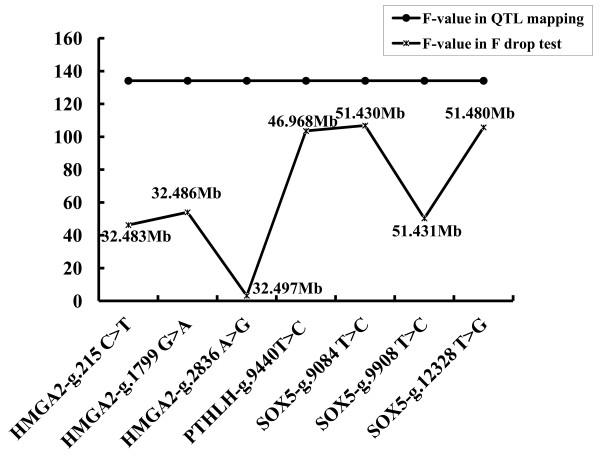
Figure 2.
F-value curves of seven SNP in the F-drop test when each SNP was included as a fixed effect. The Y-axis shows F-values and the X-axis indicates the SNP order; F (QTL): F value in QTL mapping (F-values of the model 3), F (drop): F value when the candidate SNP was included as a fixed effect in QTL mapping (values of the F-ratios between models 4 and 3)

