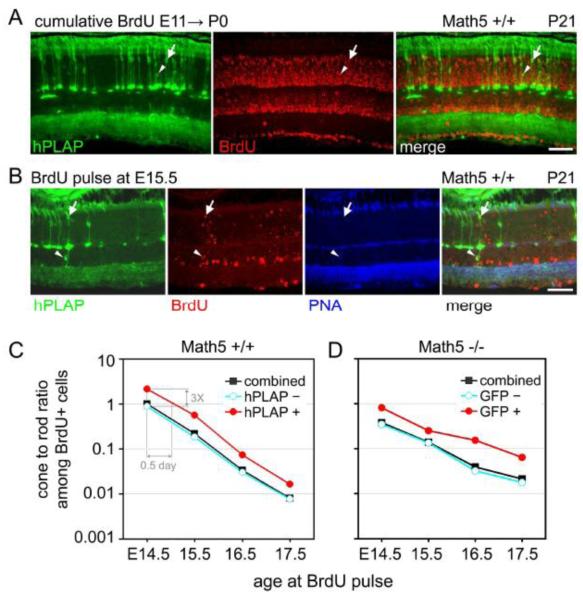
Fig. 5.
The fate distribution of Math5+ progenitors changes over time. (A) Cumulative BrdU labeling experiment. Math5>Cre; Z/AP embryos were continuously exposed to BrdU from E10.5 to P0 and their retinas were collected at P21. Nearly all Math5+ descendants (hPLAP+) are heavily labeled with BrdU, indicating that the majority exited mitosis before P0, including lineage-labeled cones (arrows) and rods (arrowheads). There is a distinct gradient of BrdU labeling (birthdates) within the inner and outer nuclear layers, such that cells with nuclei closest to the lens have earlier birthdates (brightest BrdU signal). (B) Pulsed BrdU labeling experiment. Math5>Cre; ZAP embryos were transiently exposed to BrdU at E15.5. Adult retinas were stained with hPLAP and BrdU antibodies and PNA lectin. Math5+ cone (hPLAP+ PNA+ BrdU+, arrow) and bipolar (hPLAP+ BrdU+, arrowhead) cells are indicated. (C) Cone-rod ratio plots for birthdated hPLAP+ (red), hPLAP− (blue) and combined (black) photoreceptor groups. The ratio of cone-to-rod births decreases steadily between E14.5 and E17.5 for hPLAP+ and hPLAP-populations. The curves are parallel, indicating that the fate of Math5+ cells changes over time, similar to other retinal progenitors. However, the cone-to-rod ratio is 3-fold higher for Math5+ progenitors at every time point, suggesting that these cells have a fixed cone vs. rod bias, or are shifted by 0.5 days, compared to other neurogenic cells (hPLAP−) in the same retinal environment. (D) Cone-rod ratio plot for birthdated GFP+ (red), GFP− (blue) and combined (black) photoreceptor groups in Math5 −/−; Math5>Cre; R26floxGFP mice. Scale bar, 50 m.

