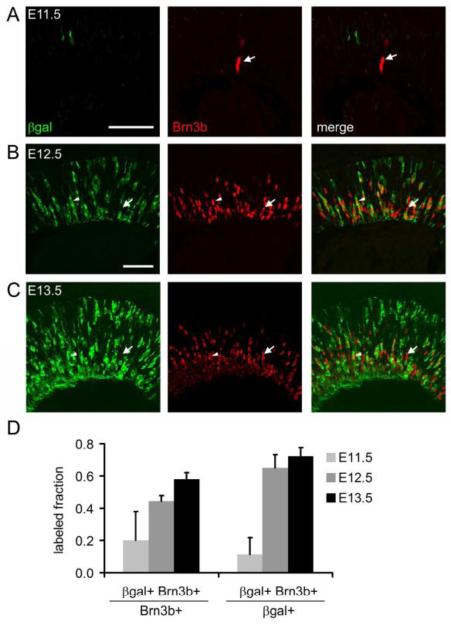
Fig. 7.
A subset of Brn3b+ RGCs derives from the Math5 lineage. (A-C) Sections from embryonic Math5-lacZ/+ retinas co-stained for βgal and Brn3b. At E11.5, relatively few Brn3b+ cells are βgal+ (A, arrow). The fraction of Brn3b+ cells expressing Math5-lacZ (arrowheads) increases from E12.5 (B) to E13.5 (C). However, there are many Math5-independent RGCs (arrows) at each age. (D) Histograms showing the fraction of Math5+ cells among Brn3b+ RGCs and the fraction of Brn3b+ RGCs within the Math5+ cohort. Error bars show the standard deviation (n = 3 sections). The total number of cells counted at E11.5, E12.5 and E13.5 was 13, 228 and 667, respectively. Scale bar, 50 μm.

