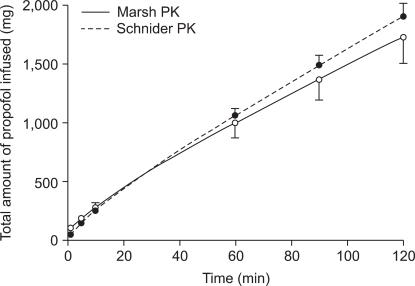
Fig. 2.
Cumulative amounts of infused propofol targeting 6.0 µg/ml of plasma concentration during 2 hr of target controlled infusion with the pharmacokinetic (PK) model of Marsh (solid line) and Schnider et al. (dotted line). Error bars show the amount of propofol infused until 1, 5, 10, 60, 90, and 120 min.

