Fig. 5.
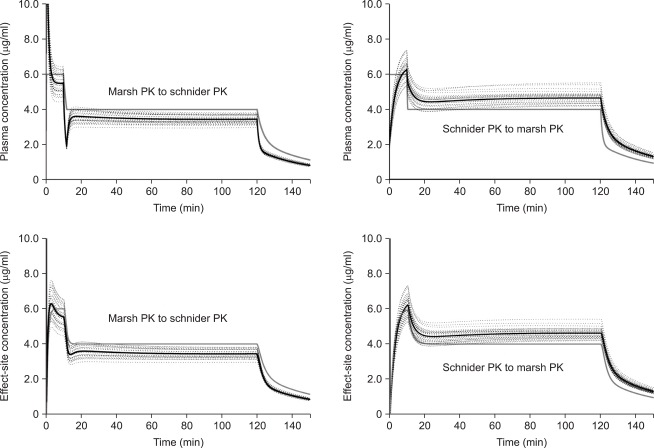
Total cross-simulation shows the time courses of the reproduced individual (dotted line) and mean (black solid line) predicted plasma (upper graphs) and effect-site (lower graphs) concentrations of propofol. Targeting 6.0 µg/ml of plasma concentration (0 to 10 min), and 4.0 µg/ml (10 min to 2 hr) (gray line). The infusion data file of the pharmacokinetic (PK) model of Marsh et al. (Marsh PK) was analyzed using the file of Schnider et al. (Schnider PK) (left graphs), and the infusion data file of Schnider PK was analyzed using Marsh PK (right graphs).

