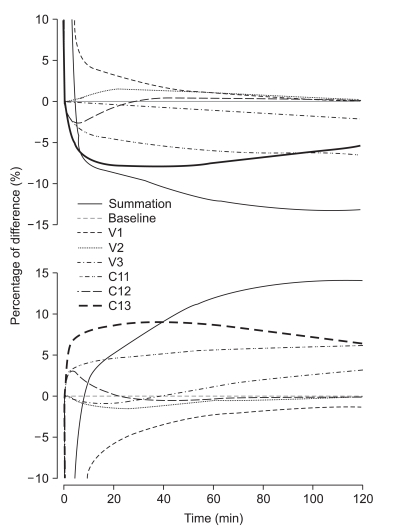
Fig. 6.
Simulation was separately investigated with one pharmacokinetic (PK) parameter (VC, V2, V3, Cl1, Cl2, and Cl3) replaced of the PK model with the corresponding value of the other model and each curve shows the time course of the percentage differences of predictions. Each parameter of Marsh PK was replaced with that of Schnider PK (upper curves), and each parameter of Schider PK was replaced with that of Marsh PK (lower curves).

