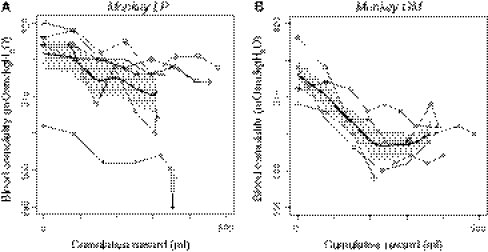
Fig. 2.
Changes in the osmolality level during reward accumulation. Changes in blood osmolality as a function of reward accumulation during the task performance in monkey LP (a) and monkey GM (b). A single session’s data, which were collected every 15 min, are plotted by distinctive symbols connected by lines. The thick line and shaded area represent the mean and SEM, respectively, for the change in osmolality with approximation (see text)

