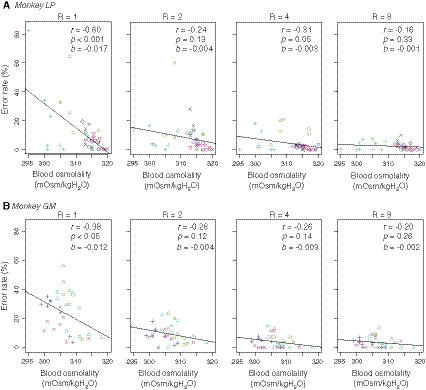
Fig. 3.
Relationship between task performance and osmolality level. The relationship between the error rate of the 1, 2, 4, and 8 drop trials and blood osmolality was plotted from left to right for monkey LP (a) and monkey GM (b). The error rates were calculated on the basis of a 20-min period around each blood sample. Each symbol represents the data from a single session

