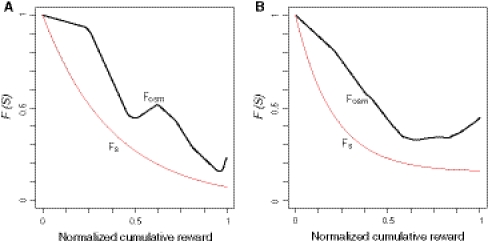
Fig. 5.
Comparison of the devaluation functions. Plotting the value of the devaluation functions with the best fit parameters against the normalized cumulative reward for monkey LP (a) and monkey GM (b). F OSM, devaluation function for their own osmolality; F S, devaluation function of the satiation level (sigmoid function)

