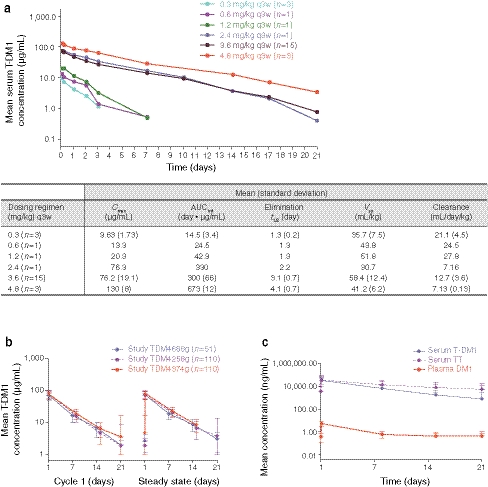
Fig. 1.
a Serum trastuzumab emtansine (T-DM1) concentration–time curves and pharmacokinetic parameters by dose level in the T-DM1 dose-escalation study TDM3569g after every-3-week (q3w) dosing. b Concentration–time curves for T-DM1 in cycle 1 and at steady state after T-DM1 dosing in TDM4258g, TDM4374g, and TDM4688g. c Mean concentration profiles combining three phase II studies (TDM4258g, TDM4374g, and TDM4688g) after first dose of T-DM1. AUCinf, area under the curve from time 0 extrapolated to infinity; C max, maximum concentration; t ½, terminal half-life; TT, total trastuzumab (T-DM1 plus unconjugated trastuzumab); V ss, steady-state volume of distribution

