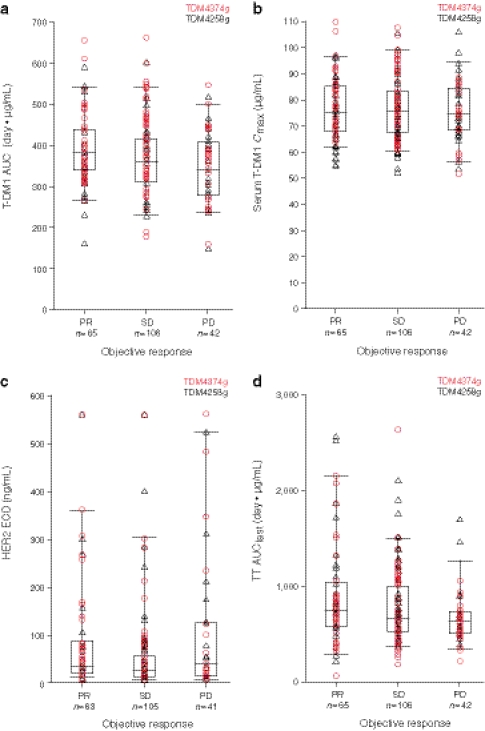
Fig. 2.
a Serum trastuzumab emtansine (T-DM1) area under the concentration–time curve (AUC) by response in patients in studies TDM4374g and TDM4258g. b Serum T-DM1 maximum concentration (C max) by response in patients in studies TDM4374g and TDM4258g. c Baseline circulating human epidermal growth factor receptor 2 (HER2) extracellular domain (ECD) by response in patients in studies TDM4374g and TDM4258g. d TT AUClast by response in patients in studies TDM4374g and TDM4258g. AUClast, area under the concentration–time curve in the last sample drawn; PD progressive disease, PR partial response, SD stable disease, TT total trastuzumab (T-DM1 plus unconjugated trastuzumab)

